The demographic prepayment curve reveals itself
Prepayment modelling has been the exclusive topic for well-respected econometricians and mathematicians for ages. Big data sets were presented by the analysts to mysterious applications, and the prepayment vectors were calculated and produced automatically and statistically significant.


Door Schalko Deddens
Portfolio Manager
In the period between 2017 and to date 2024, we are in an interest environment that deep dive calculations have become redundant. At least, as it relates to the demographic part of the prepayment function. In the below, we present a graphical determination of the demographic prepayment function. Not necessarily statistically significant, but we just looked at the graphs and produced our own estimation of this curve. The curve reveals itself.
Prepayment modelling
To start with, a very brief overview of prepayment theory. Theory tells:
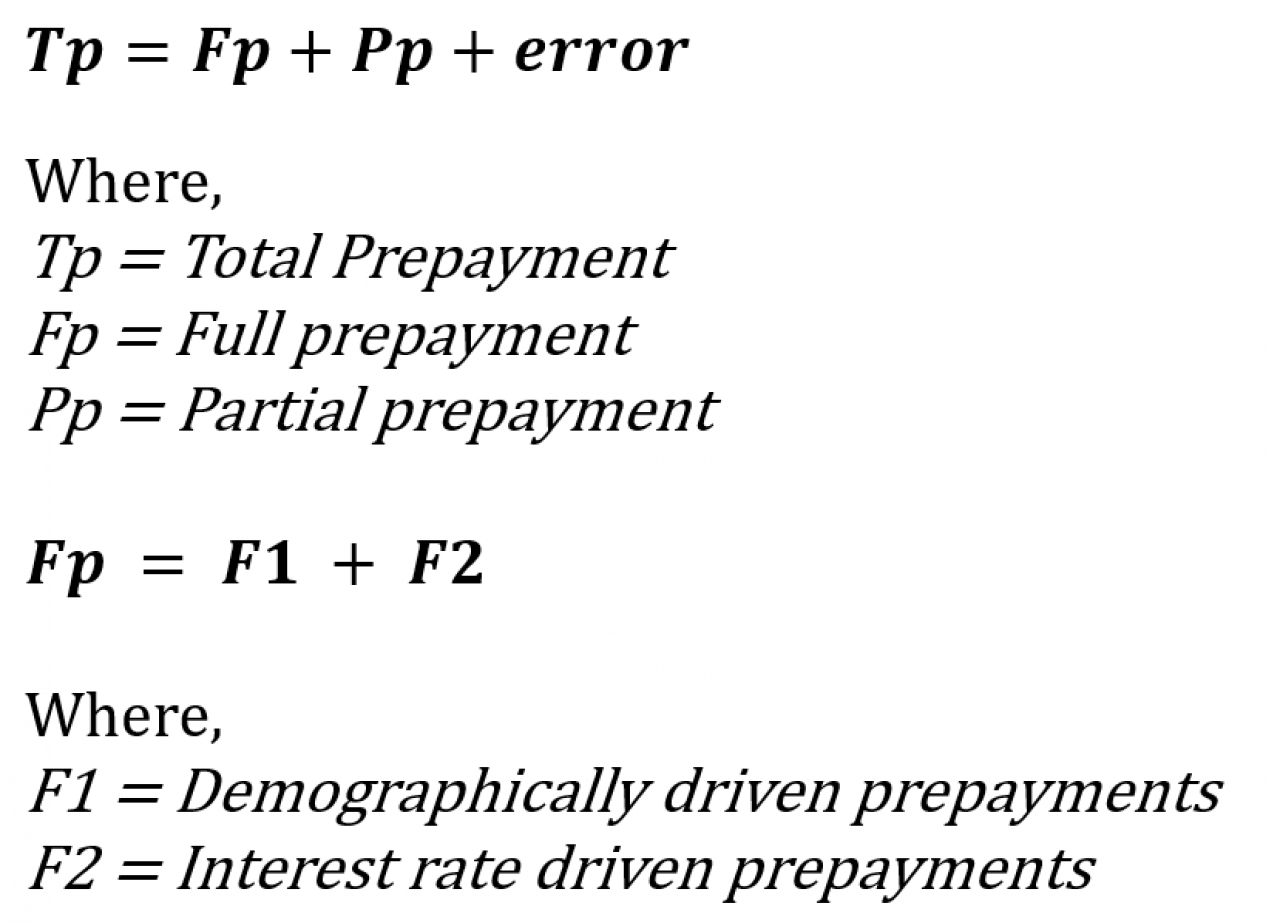
In this article, we focus on F1 and F2. Partial prepayments do exist, but due to the relative size of partial prepayments compared to full prepayments, we ignore them. We also ignore all the driving variables for both functions, like age of the borrower, LTV and whatever variable can be defined as statistically relevant.
In our portfolio, we have 2 reasons for full prepayment available. Selling the house and refinance. Please note that selling the house is always without prepayment penalty, and refinance is with a make whole prepayment penalty if the prevailing market rate of the remaining interest term is lower than the borrower rate.
F1 Demographic prepayments are primarily driven by moving houses, and to a lesser extent divorce (subcategory of moving houses) and death of the borrower.
F2 The refinance incentive part of the prepayment function adds to the total prepayments if the difference between the current mortgage rate of the borrower minus the prevailing mortgage rates in the market is positive. A large negative incentive reduces the contribution of the refinance function to the total prepayments to 0. In such case, the demographic function is dominant in the prepayment percentage in a portfolio.
DMPM insights on prepayment curves
In our reporting dashboards, we have analyses available which show the prepayment on a dynamic cohort basis. Each cohort is defined by its age, but with the loans ageing, loans move each birthday after origination to the next cohort. This allows a cohort analysis on a calendar basis. For example: a loan originated on January 1st 2021 is in the 0-12 month cohort during 2021. Per January 1st 2022, this loan moves to the 13-24 cohort, etcetera. For each given calendar month, we measure the prepayment per cohort. In this way, we have a view on prepayments that are 0-12 months old at any given date, prepayments on loans that are 13-24 months old etcetera, on a calendar basis.
Our originations started in late 2016, early 2017. Essentially, each loan in our portfolio until the end of 2021 had a positive refinance incentive. Originations since 2022 had the benefit to see mortgage rates to increase since origination. This is pictured in figure 1 below for the 10Y NHG rates. The shape of the curve is very comparable to other combinations of interest terms and risk classes. Only the level of the mortgage rates are different for those combinations. Therefore, we limit ourselves in the below graph to the 10Y NHG rates for illustration purposes.
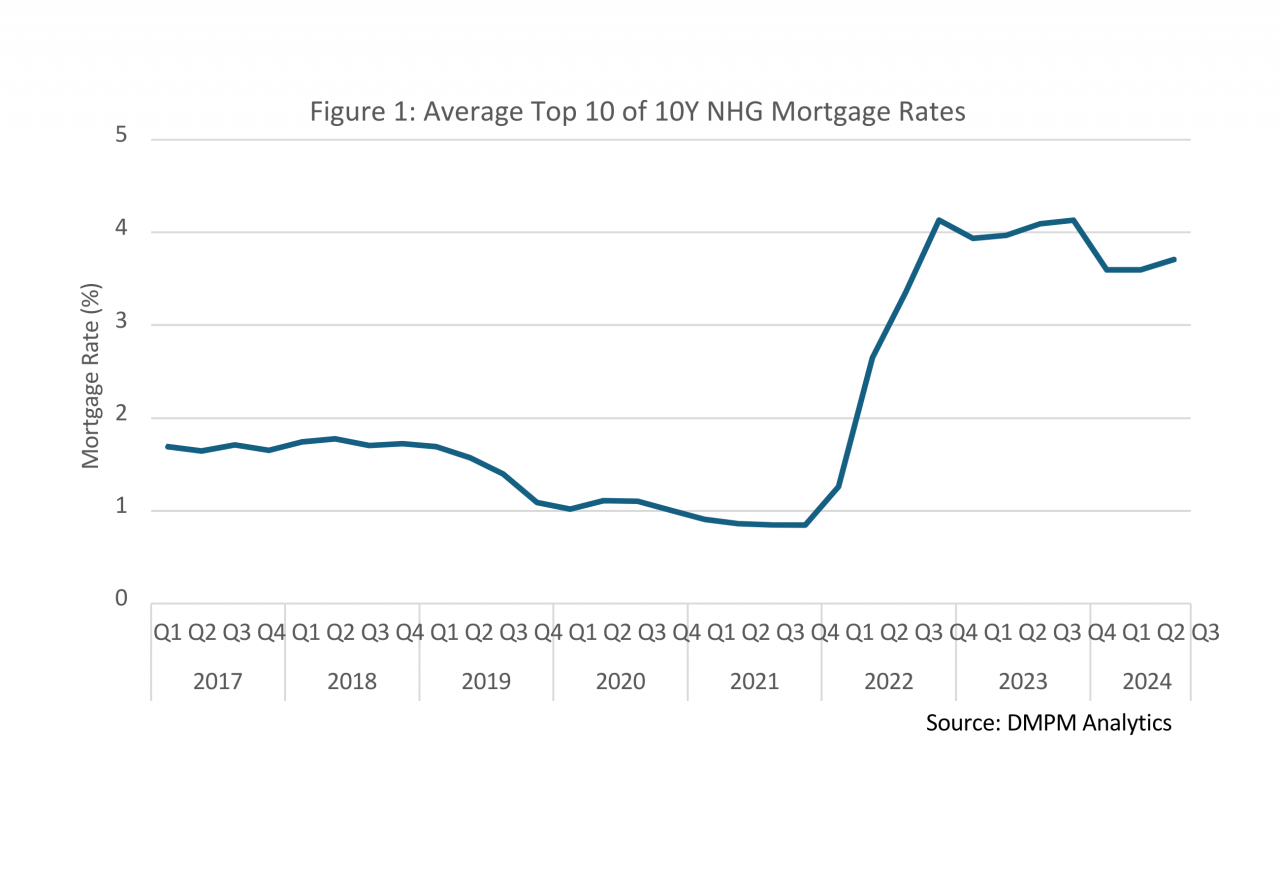
Roughly, from 2017 until February 2022, there was positive interest rate incentive for refinancing, due to the decreasing trend in mortgage rates. Later in this analysis, the end of the period in February 2022 translates into a peak of prepayments during the second quarter of 2022, due to the timing difference in applying for a refinance loan and the actual start date of such loan (and thus, the prepayment of our loan). After the second quarter of 2022, the refinancing prepayment window closed. There is slight decrease in the interest rates since the peak in the 3rd quarter of 2023 until today. That may cause interest rate driven prepayments of the 0-12 months old cohort per June 2024.
The prepayment per age-cohort since 2017 is shown in figure 2 below. Please note that the below prepayments do not take any loan porting into account. We present cash prepayment percentages, and not the ALM percentages. In the ALM percentages, the continuation of interest contracts after loan porting is corrected.
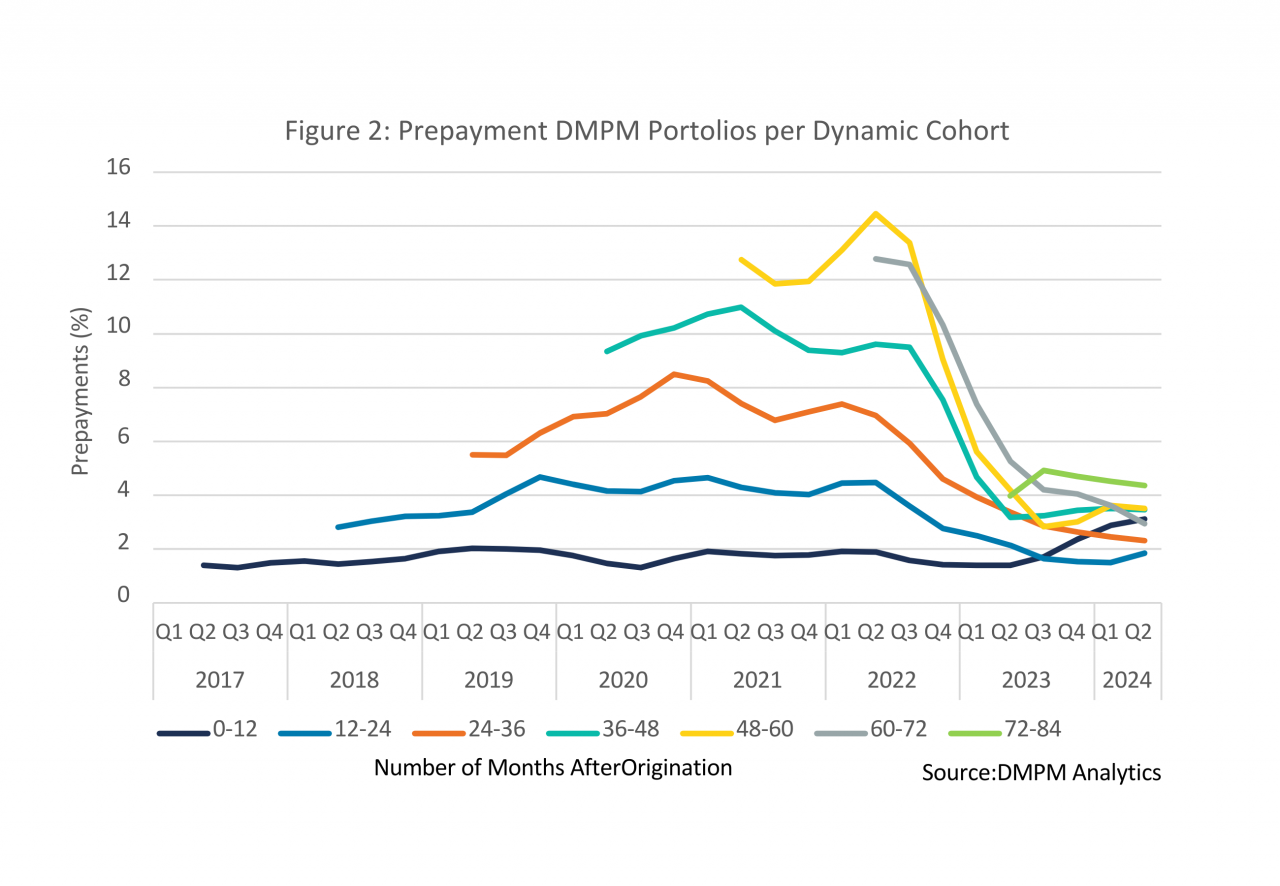
This graph shows the peak in prepayments in the first half of 2022. That is an obvious observation. However, our attention was drawn to the right hand side of the graph. For each cohort, the prepayment curve is virtually flat since 12 months. Only prepayments from moving houses are causing this behavior, in the absence of refinance incentives. There is one exception, and that is the cohort 0-12 months. This matches perfectly with our intuition that prepayments have picked up for loans that were originated since the 3rd quarter of 2023.
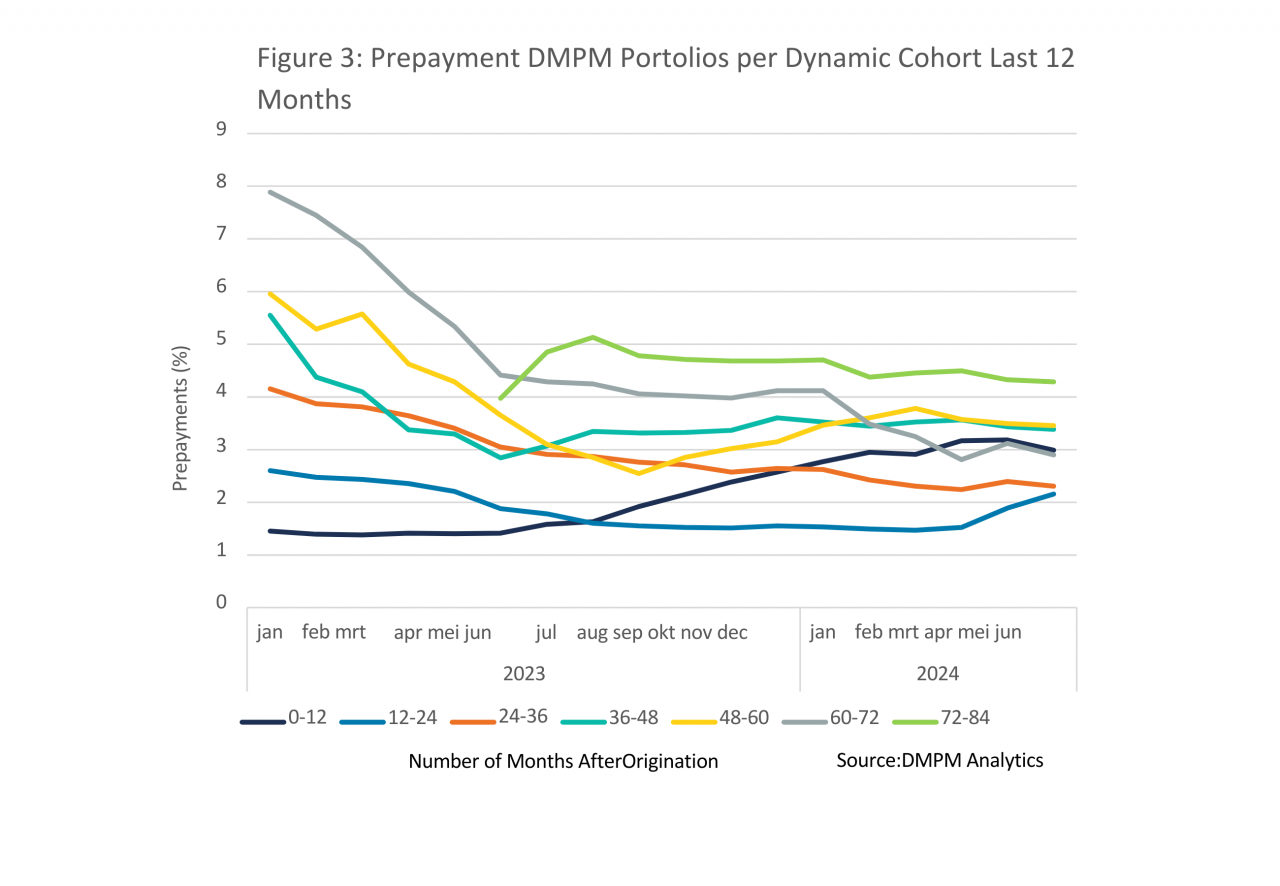
Zooming in into the detail for the last 12 months, the graph looks as follows:
From cohort analysis to demographic prepayment curve
Each color in the last graph above represents the prepayment by age of the underlying loans. Except for the cohort of 0-12 months, none of the prepayment curves is spoiled by a refinance incentive and is almost uniquely driven by demographic factors since mid 2023. Why only mid 2023? In the previous sections we stated that the refinancing window ended in the second quarter of 2022. That is because the graphs are calculated using a moving average of conditional prepayment rates (CPR). The lagging effect of this moving average has fully disappeared in mid 2023.
Assuming a long term prepayment average of 1.5% for the cohort 0-12 (seems reasonable as refinancing within a year after origination is highly unlikely and the long term graph indicates a long term stable prepayment rate of 1.5% for newly originated loans in the first year), we can create a demographic prepayment curve based on the behavior of our portfolio in the last 12 months. This is done by assuming horizontal lines per cohort taking the average for each cohort in the detail graph over the last 12 months. Now, the x-axis is no longer on a calendar basis, but on a seasoning basis (loan age). With some manipulation in the 4 and 5 year old loans, we come up with the following graph.
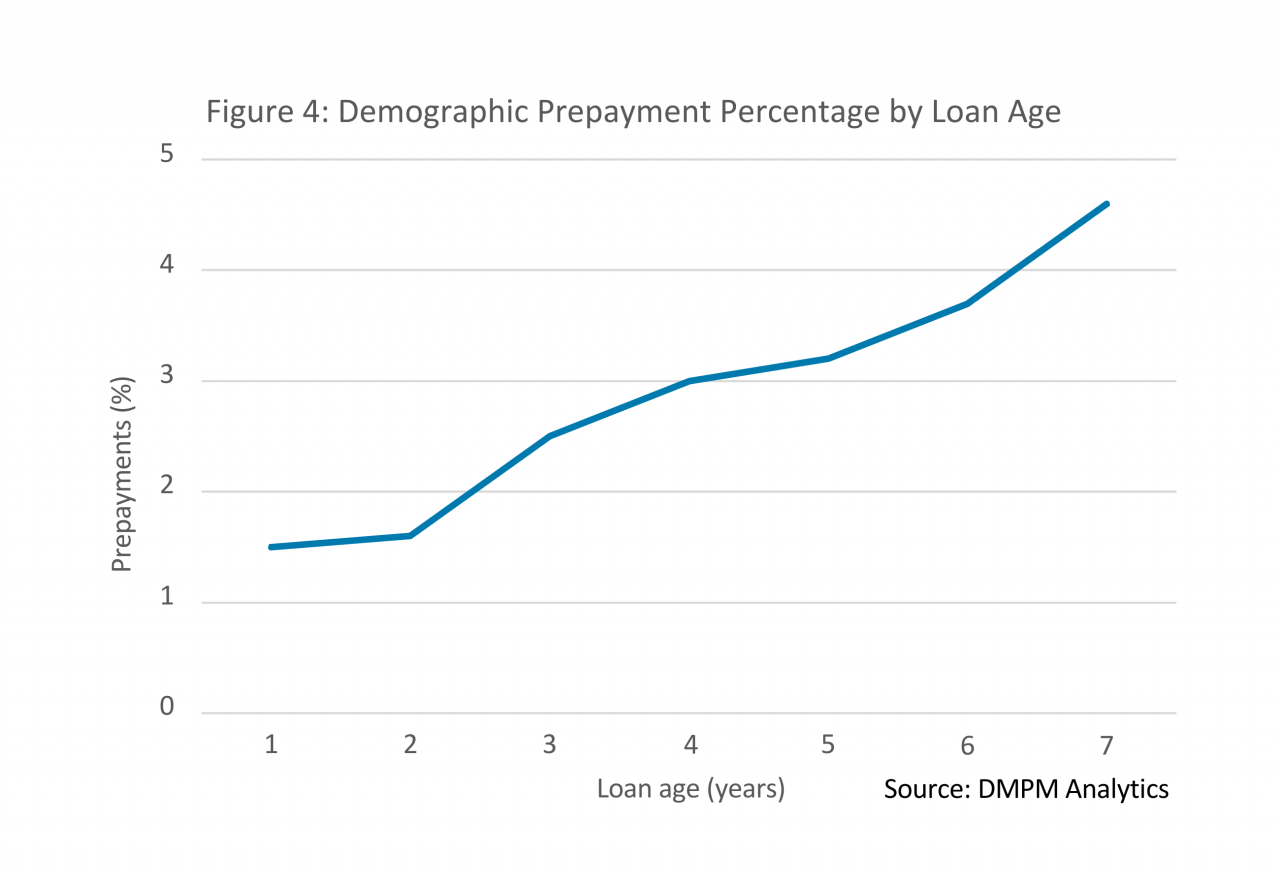
With the knowledge that the housing turnover is about 4% to 5% per year, we expect this curve to flatten after a loan age of 7 years.
Conclusions
The past 12 months provide a surprising insight in the shape of the demographic prepayment curve. Without claiming to be statistically significant, the prepayments in our portfolio exhibit a reasonable and intuitively predictable pattern, just by looking at the graphs. Just the fact that the graphs showed the portfolio behavior as described above, was the reason to share this portfolio insight. Predicting a demographic prepayment curve is no longer rocket science, but interpretation of graphs without analyzing the underlying data. Theory, intuition and practice come together. We add the disclaimer that each ALM manager should base his hedging strategy on his own research.
We have the following further considerations to our own analysis:
- We present moving averages of the prepayment curves. This is arbitrary.
- We have mixed the loan purpose “purchase” and “refinance” in this analysis to create the cohorts.
- We have not taken into account the loan porting activity on the above prepayments. Therefore, the Asset Liability prepayment is different than the cash prepayment (the ALM prepayment is lower than the above presented curve because loan porting results in a continuation of the interest contract).
- We have not taken into account the purchase year of the loans that were originated as refinancing loans. We have just presented the demographic portion of the prepayments by loan age, irrespective of the purpose of the loan.
There is a reason for this list of imperfections. We cannot reveal all the secrets of our portfolio. But are you interested in further analyses? Please contact schalko.deddens@dmpm.nl.
Want to read more?
This article is part of our Quarterly Market Update for Q2 2024. In this report, we outline developments in the Dutch economy, the housing market and the mortgage market, and conclude with some key portfolio insights. You can download the full report here.
Would you like to receive the next Quarterly Update in your mailbox? Simply subscribe to our updates by sending your email address to info@dmpm.nl with the subject line 'Quarterly Update.'