
ECB holds cards close to the chest
As broadly expected, the ECB policy rates remained unchanged in the December meeting. And to bring it briefly back to memory, the main policy rate, the deposit rate, is currently at 2%. Similar to earlier meetings, ECB President Lagarde made clear that with respect to interest rates, the ECB is in a “good place”. In other words, with the inflation rate and inflation rate projections close to target, and economic growth above earlier expectations, interest rates are right where they need to be, see table 1.1. For that reason the decision to keep rates on hold was also taken unanimous. This means that since last June rates remained on hold and according to a BNP Paribas, ABN AMRO and ING that will likely remain the case in 2026. One exception is Morgan Stanley. Their base case is a cut of 50bp in 2026. They expect a further weakening of the dollar and therefore an appreciation of the euro. This has the potential that the ECB will undershoot inflation, and as a result further rate cuts are required to mitigate this risk.
Table 1.1: Growth and inflation projections for the euro area

ECB
Dutch economic growth surprises to the upside
Now that the year 2025 is behind us, we can compare the macro-economic performance of 2025 vs earlier years. Starting with economic growth, economic growth in Q4 of 2025 compared to the same period in 2024, came at 1.7%, see figure 1.1. The consensus estimate for the fourth quarter was lower. For 2025 as a whole, economic year over year growth was 1.9%. Main contributors where exports, government and household consumption. Figure 1.1 below also shows that Dutch economic growth outpaced the euro area economic growth in 2025. Especially the slower growth of the German and France economies where a drag to this euro area average.
Figure 1.1: Dutch and Euro Area Economic Growth
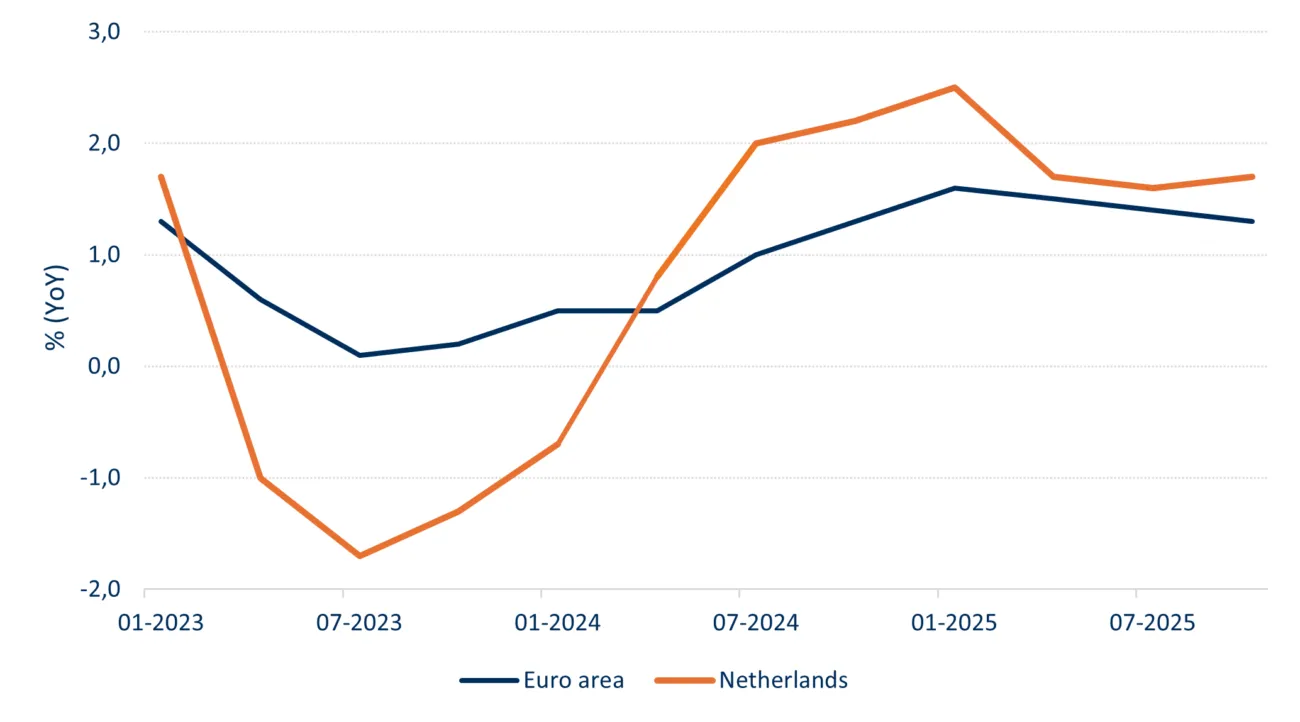
Eurostat
In 2026 headwind is expected from continuing issues with net congestion on the electricity grid and nitrogen emission limits. These two major issues will limit economic growth in 2026, and ABN AMRO expects economic growth to decrease to 1.2%. To relate that to the housing market, capacity limits on the electricity grid and nitrogen limits also have significantly impact on the housing construction capacity, as these factors limit the number of houses that can be constructed each year.
Real Wage Growth Remains Strong
Judging from figure 1.2 below, real wage growth stabilized in 2025 and remained stuck at around 1.6%. Although that’s significantly lower than the top of 2024, it’s still well above the long term average. Wage growth decreased from 5.4% in the first quarter of 2025 to 4.6% in the last quarter of 2025. Although inflation is levelling off from between 3.0 and 4.0% to 2.5% in December 2025, according to the European HICP definition, it still significantly above the 2%. Also compared to the eurozone average of 1.9%, Dutch inflation is still relatively high.
Figure 1.2: Wage Growth Compared to Real Wage Growth
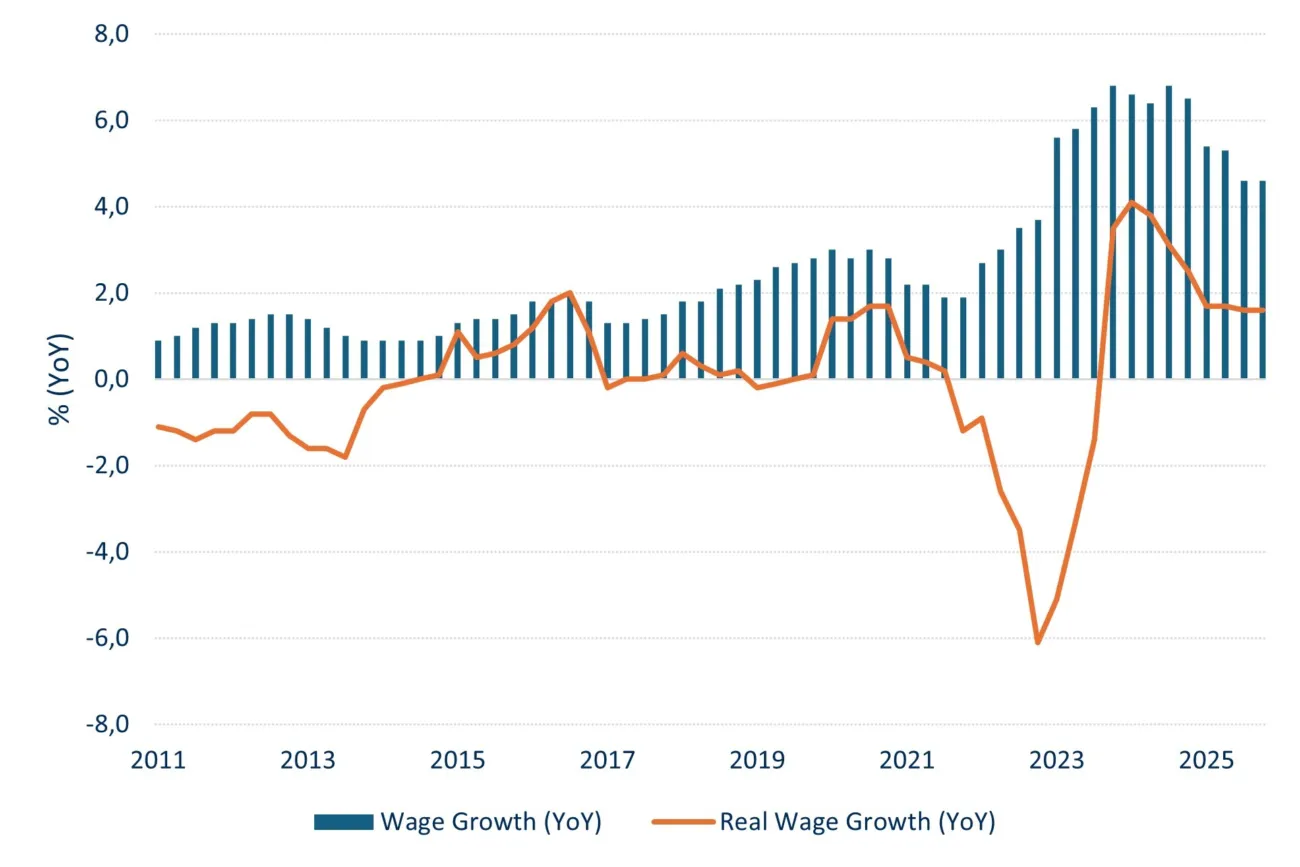
CBS
We keep a close eye how inflation evolves and more specifically real wages. The latter gives insight of the purchasing power of households, and that again is an important input to analyse how credit risks of Dutch residential mortgages will evolve over time.
Swaps touch the highest level in two years
Volatility in capital markets was quite abundant in 2025. The 10-year swap rate started the year 2.35% and ended the year at 2,95%, an increase of 60bp, see figure 1.3 below. In addition, the volatility in the first week of March was unprecedented, or to be more precise we have to go back more than 30 years to find an intraday move of almost 30bp in 10 years swaps. This movement was the result of the announcement of the German government to no longer strictly uphold their debt limit. The German Bund rate moved up sharply and swaps followed suit.
Figure 1.3: 10 and 20 years swap rates
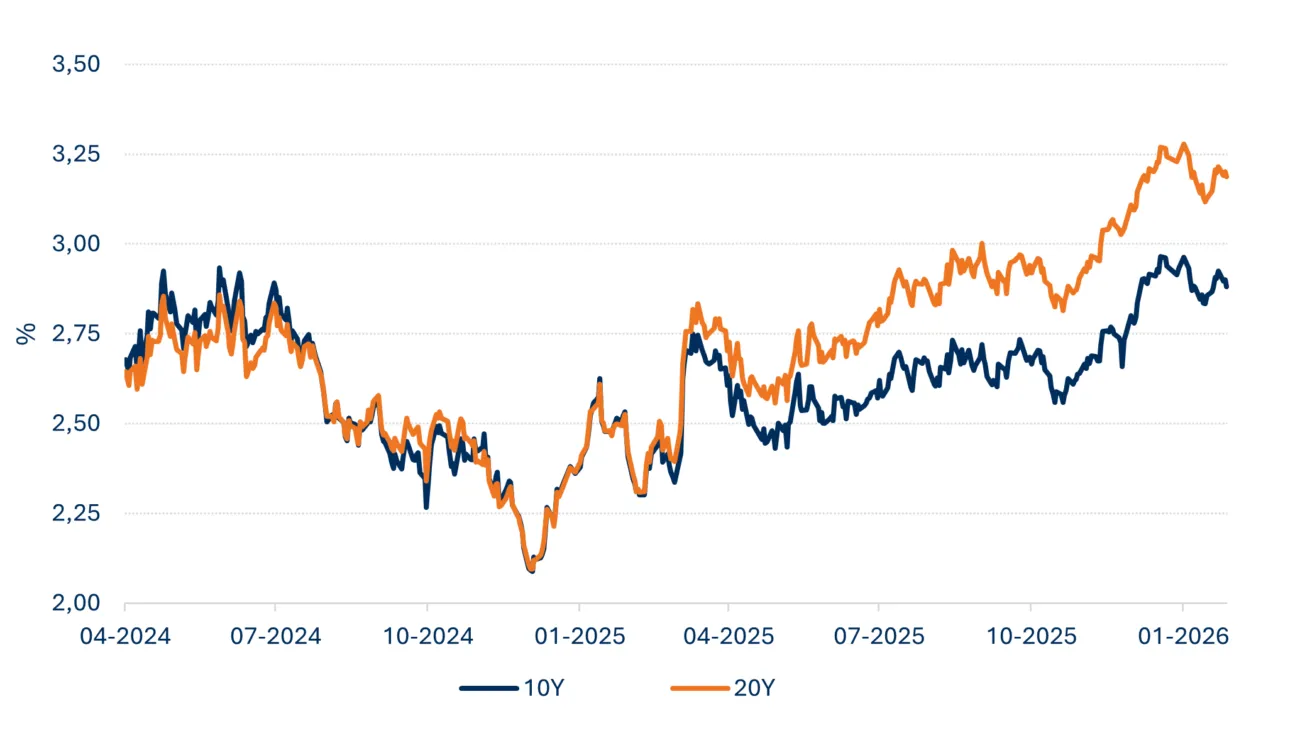
DMPM Analytics
Another noteworthy change in 2025 is the spread increase between 10 and 20 year swaps. According to figure 1.3, and better visualized in figure 1.4, the 10-20 spread started the year around 0bp but increased to above 30bp. In Q4 2025 the curve steepened another 5bp. The steepness of the curve does likely have an effect on the preference for consumers to opt for shorter fixed interest rate periods. The longer fixed interest rate period has become relative (too) expensive. Currently between 80-90% of the mortgage applications have a fixed interest period of 10 years. In 2020 to 2022, that was the other way around.
Figure 1.4: 10-20 year swap curve spread
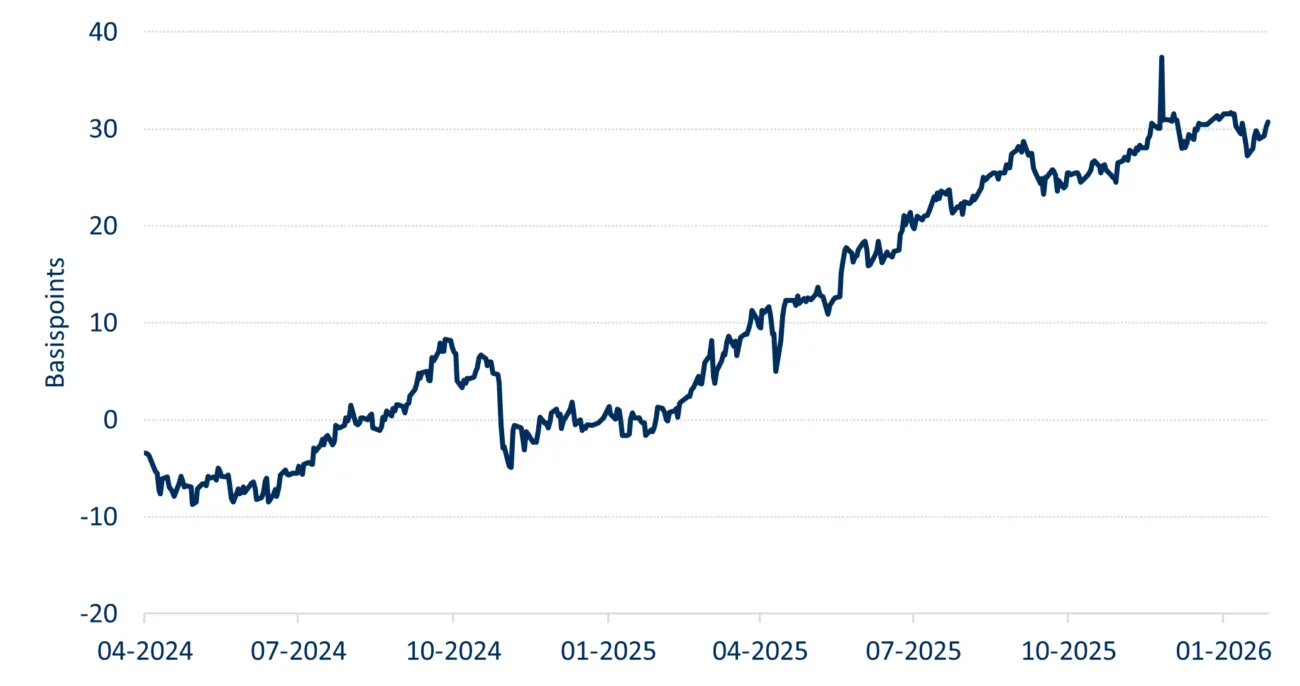
DMPM Analytics