
- Mortgage applications hit a record high in Q2 2025.
- Loan porting rates have stabilized just below 30%.
- Shorter fixed-rate terms (0-10 years) are now the market norm.
Growing mortgage market
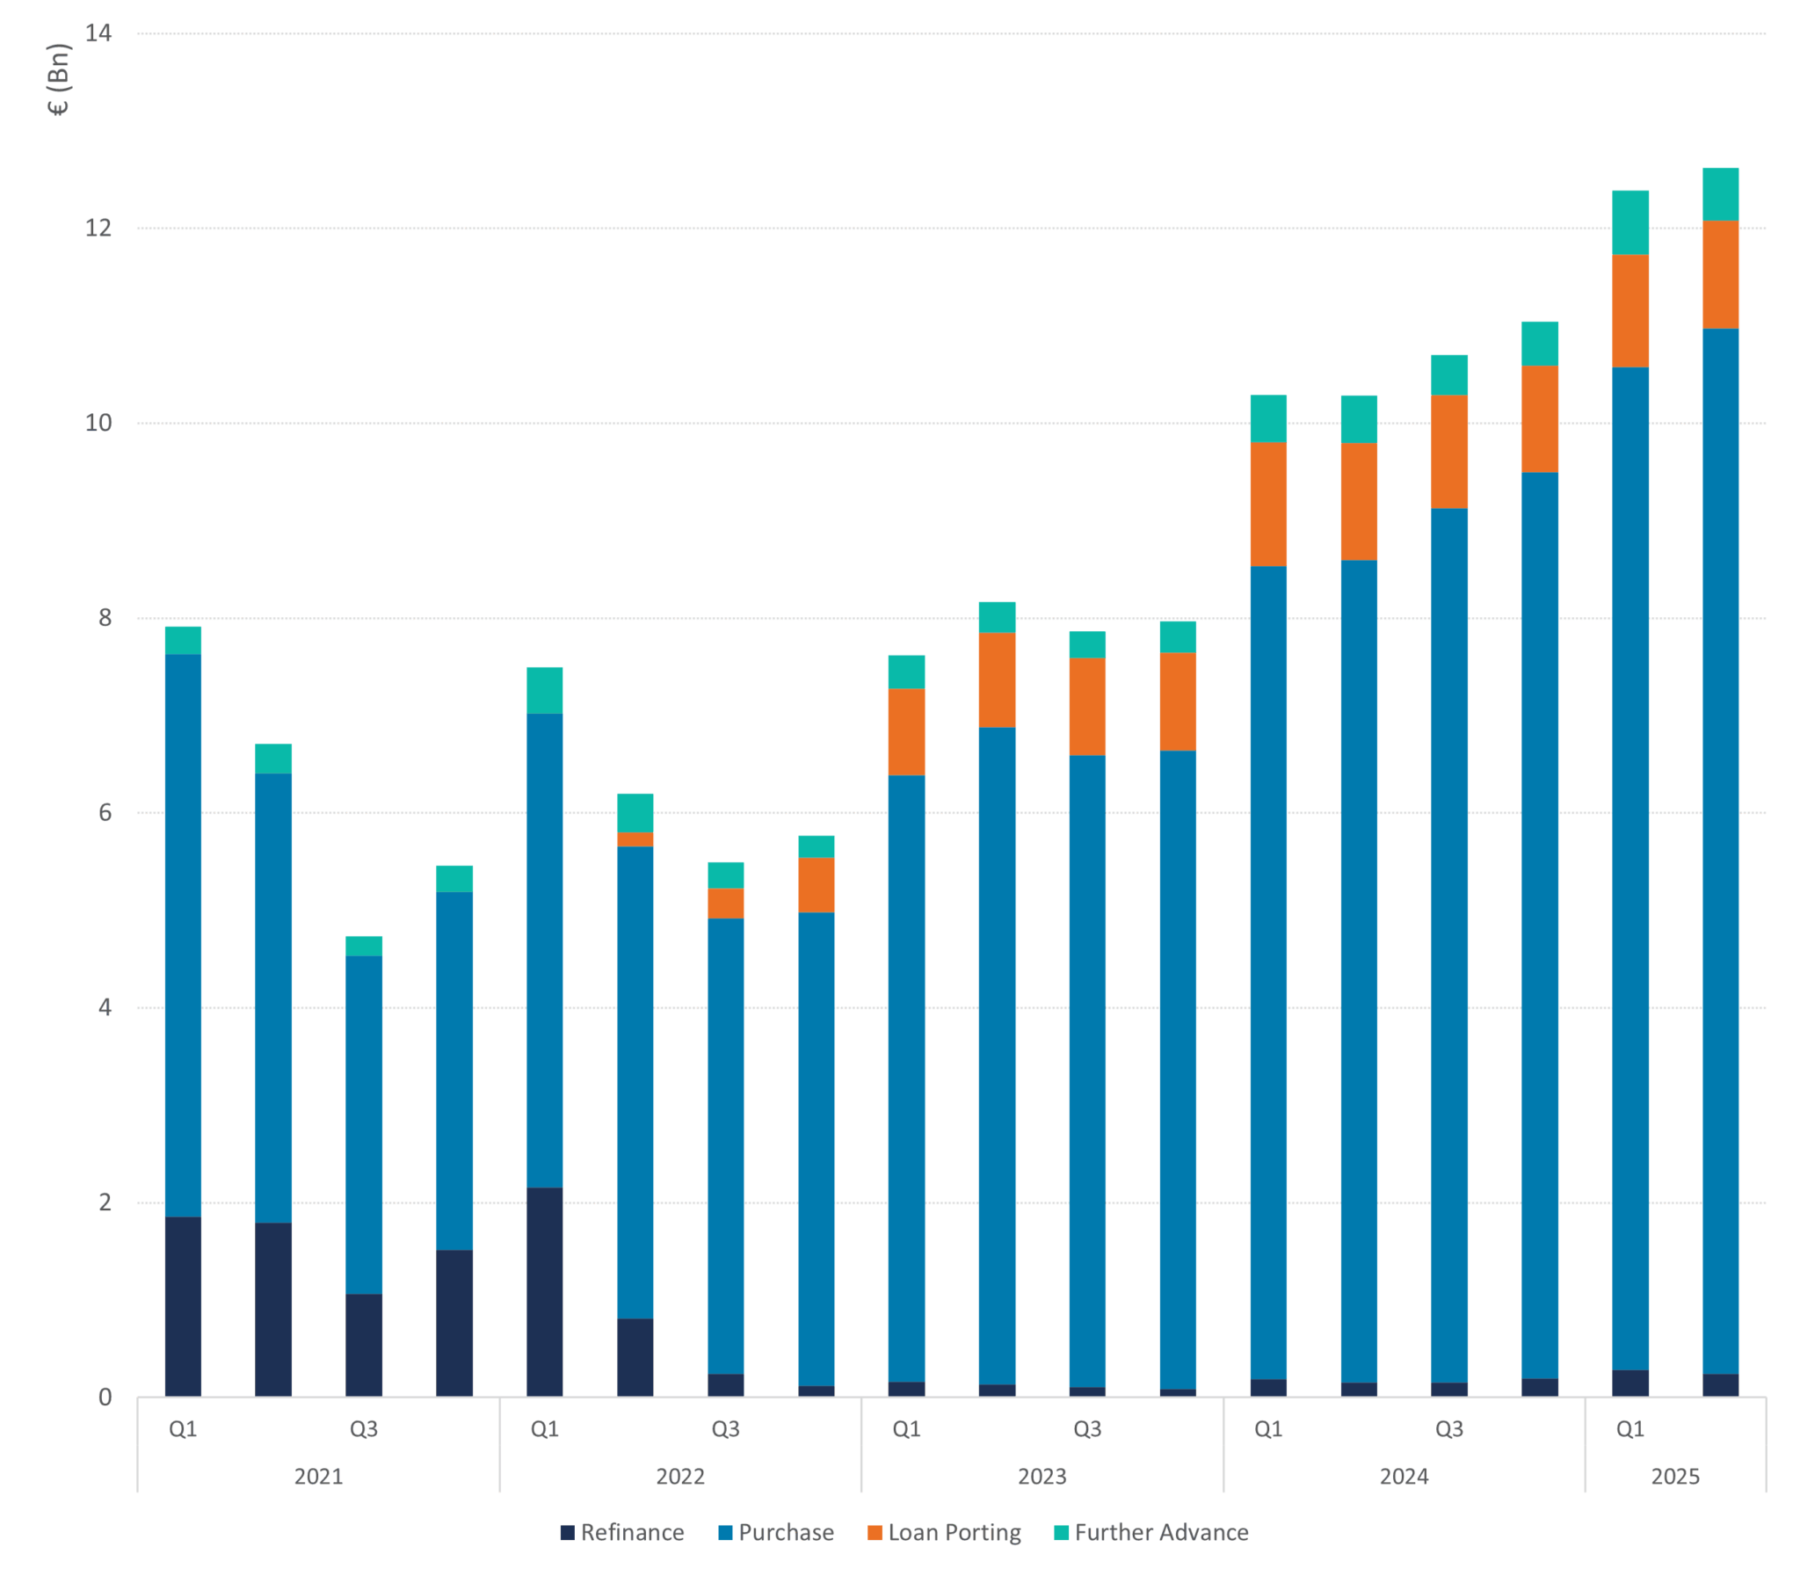
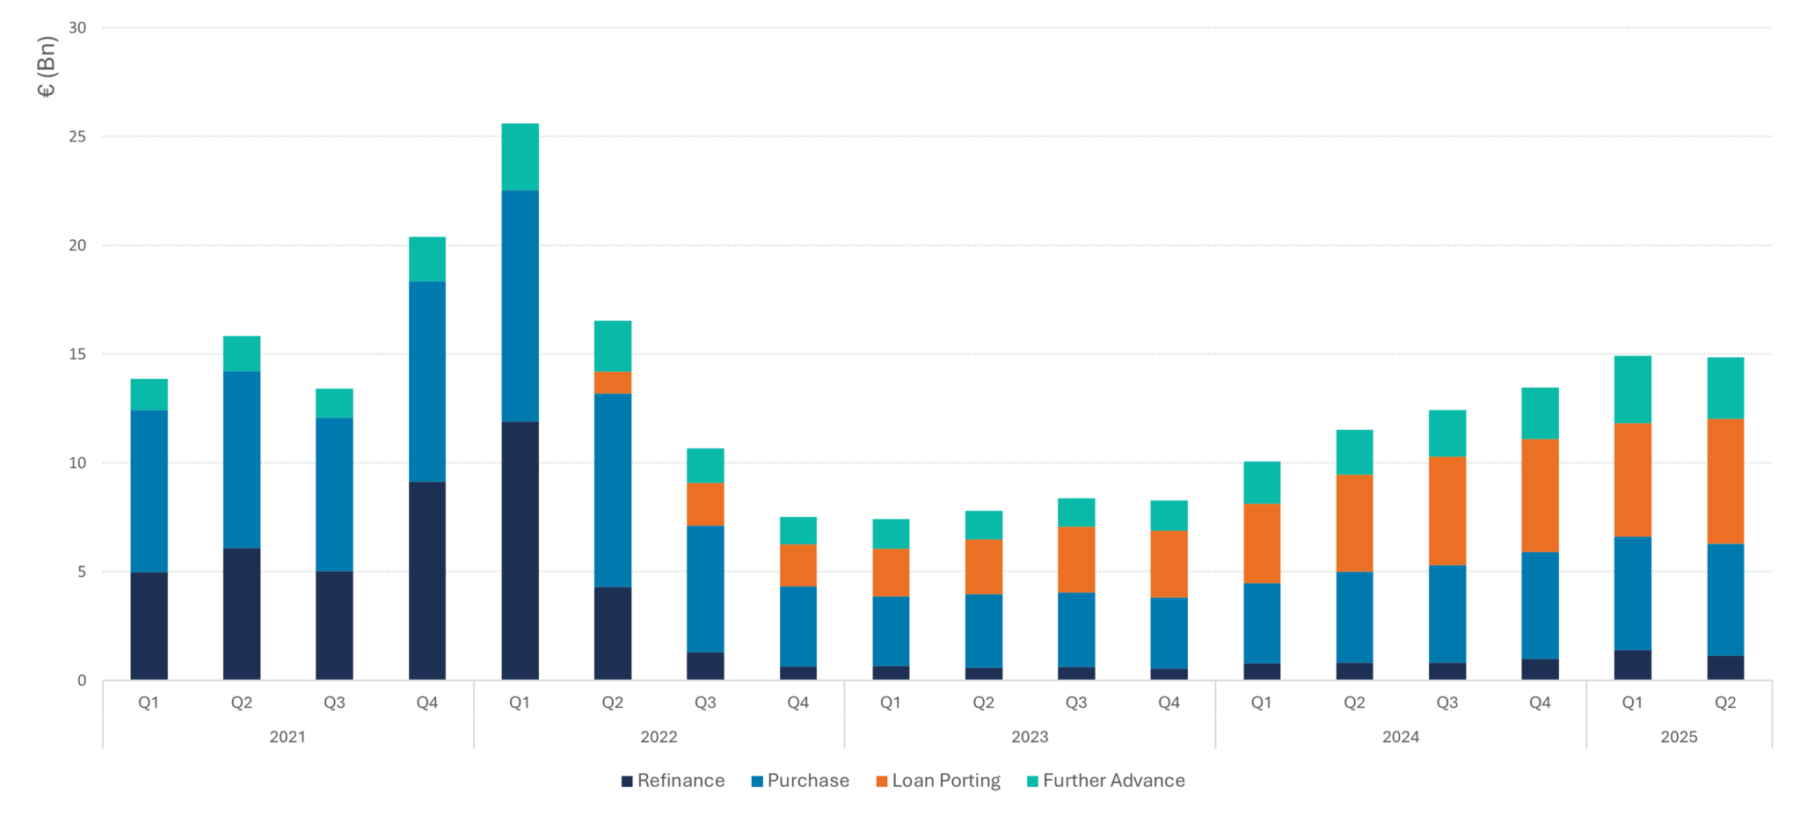
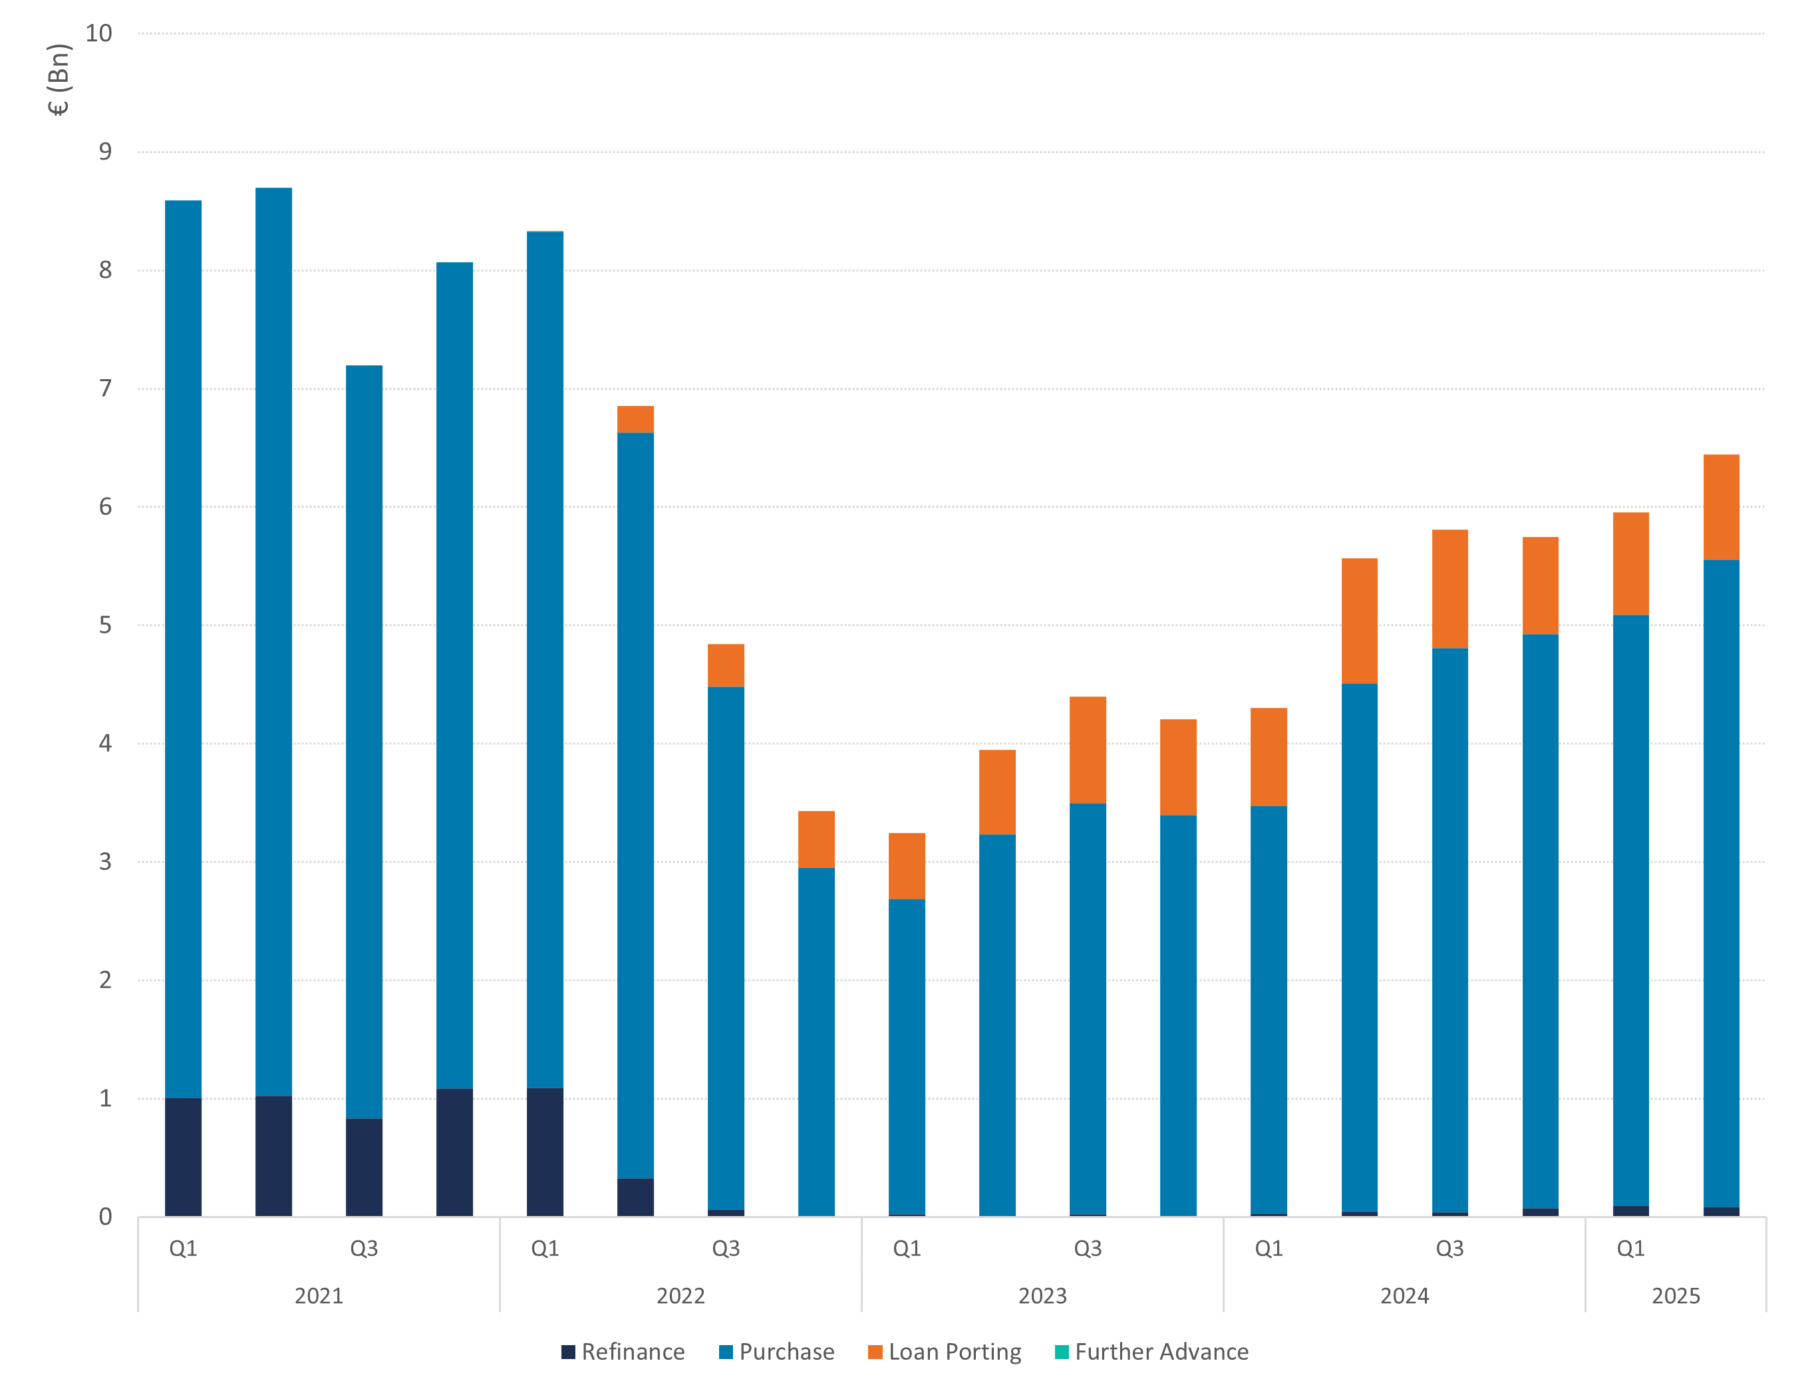
Mortgage application volumes rose in the second quarter of 2025, continuing the trend that started in Q1 2023. The total application market finished at € 37.3 bn, a record since Q1 2022, when the refinance market was still flourishing. Overall the mortgage market was 2.3% larger than the previous quarter.
Figure 1: Mortgage applications per loan type (€)
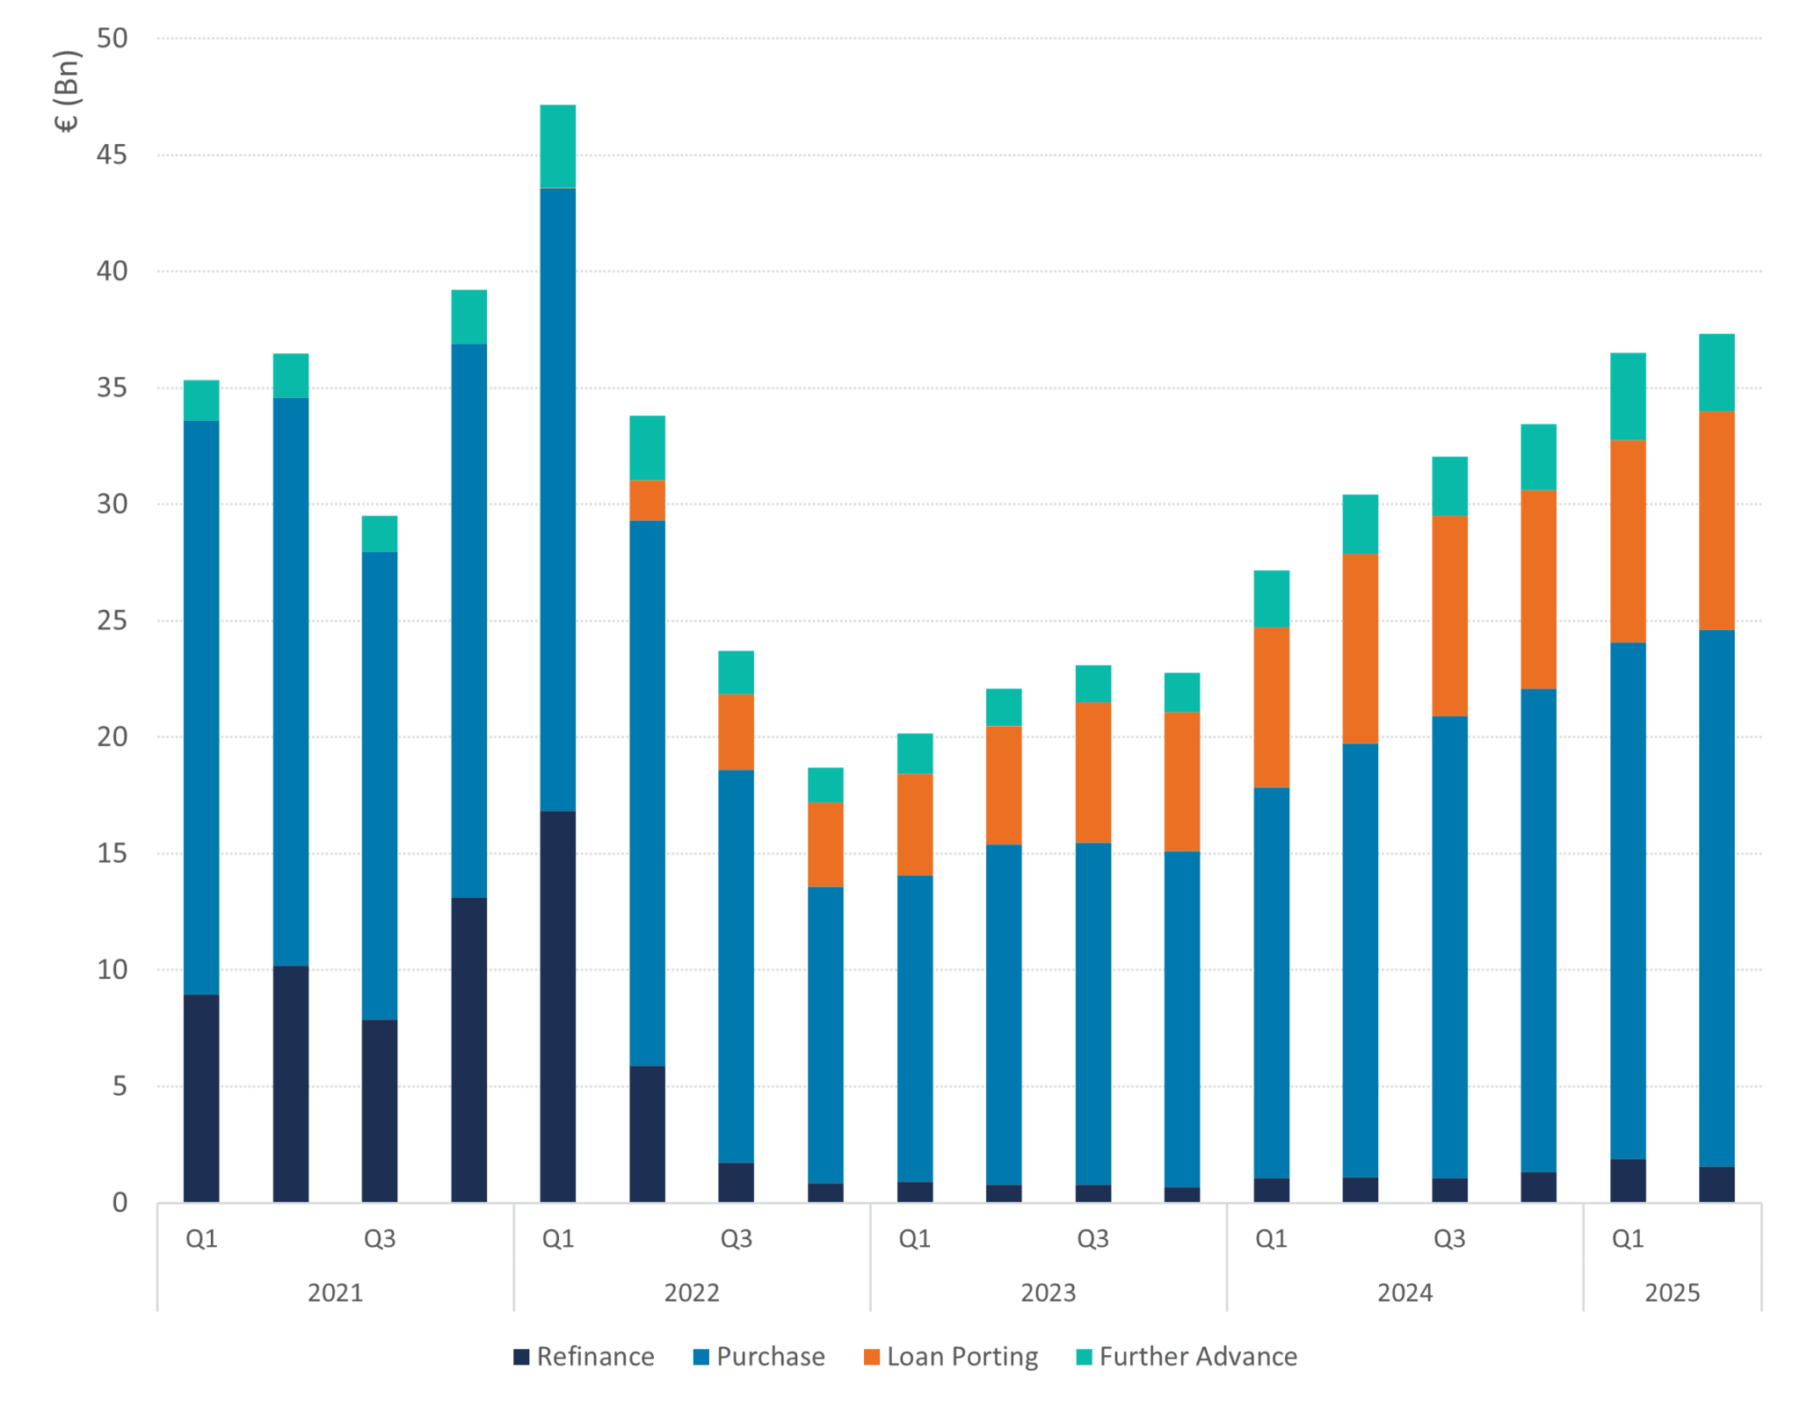
Source: HDN, DMPM analytics
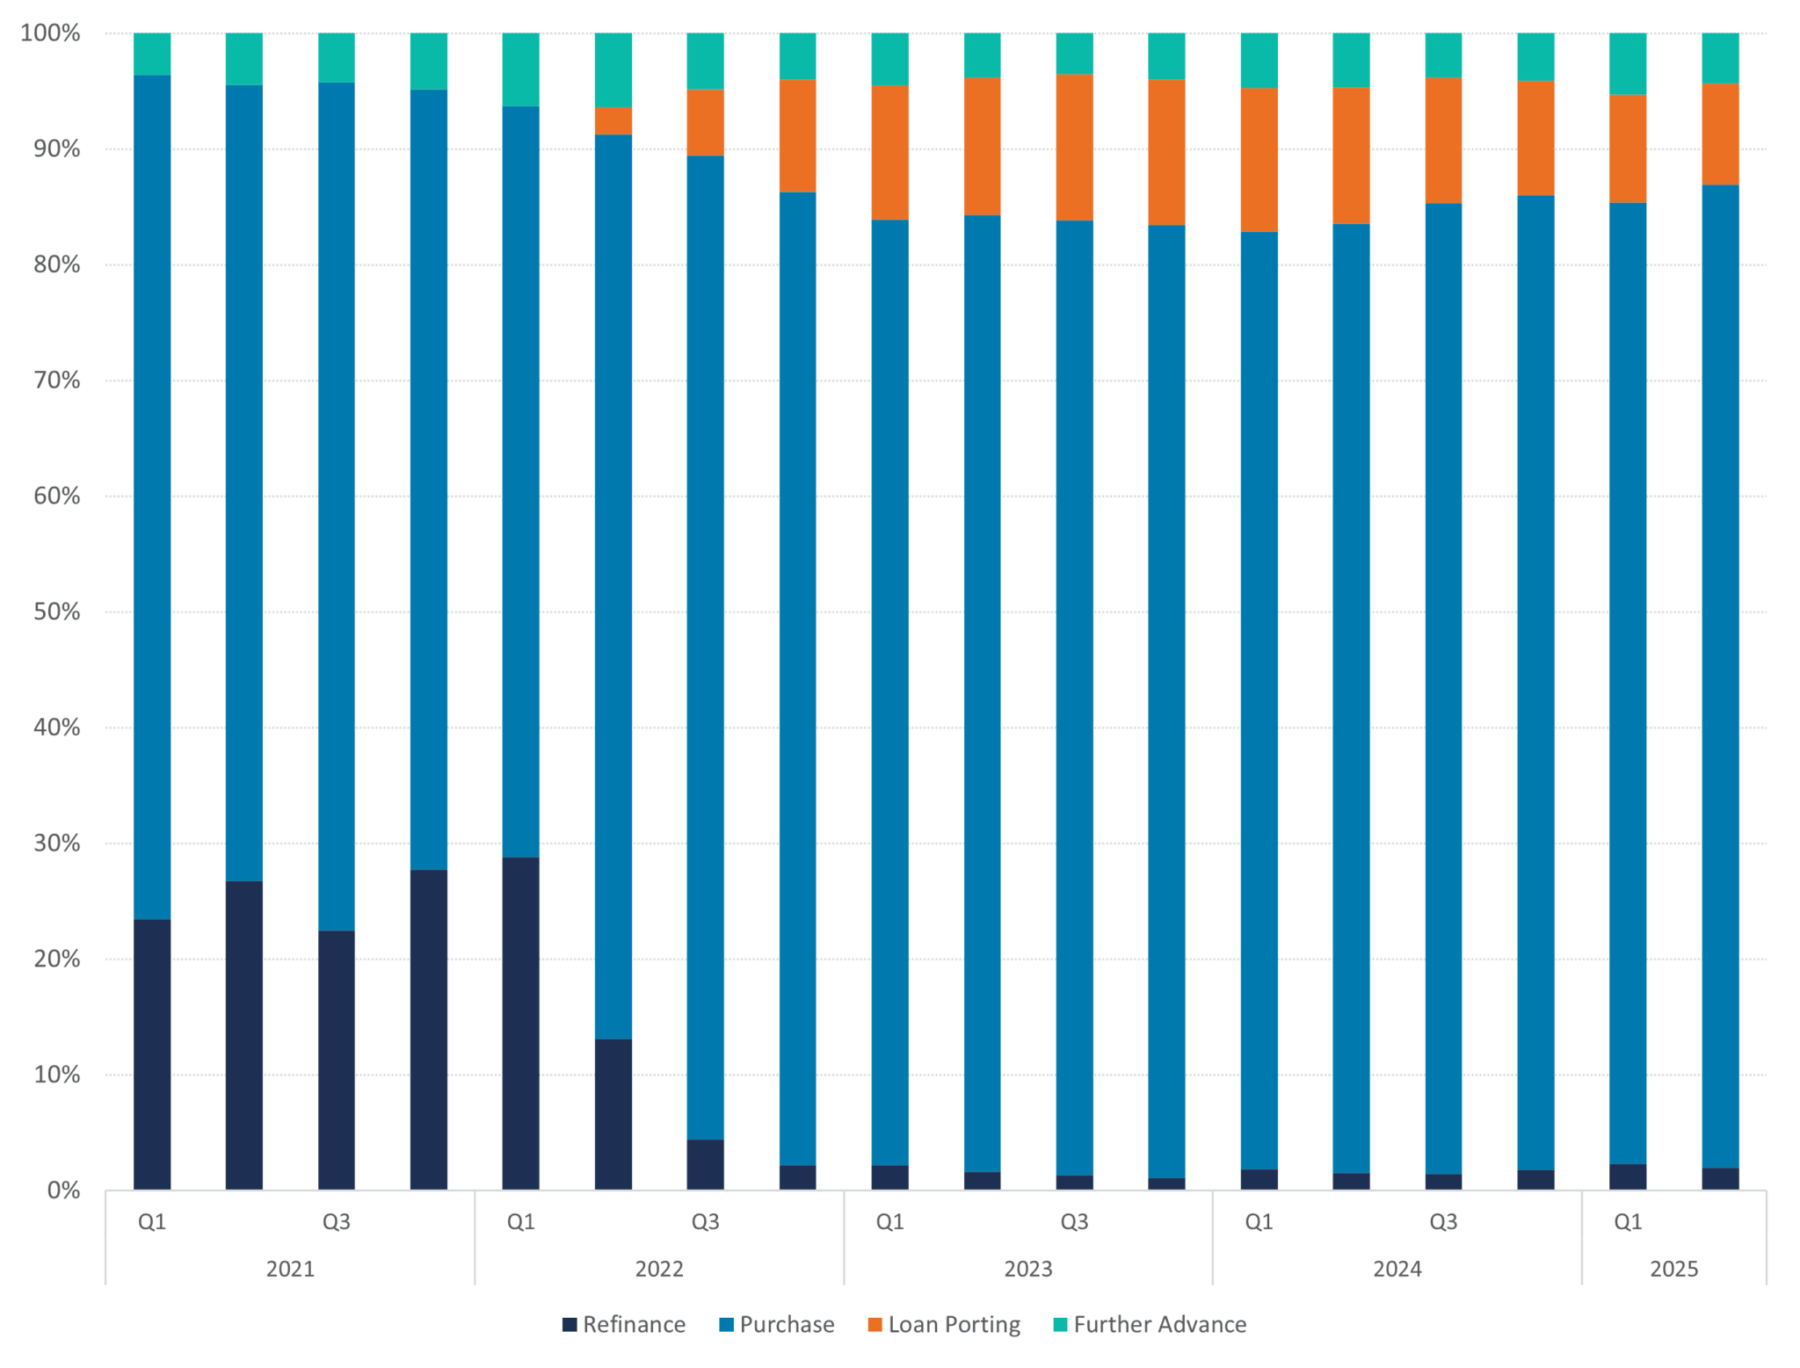
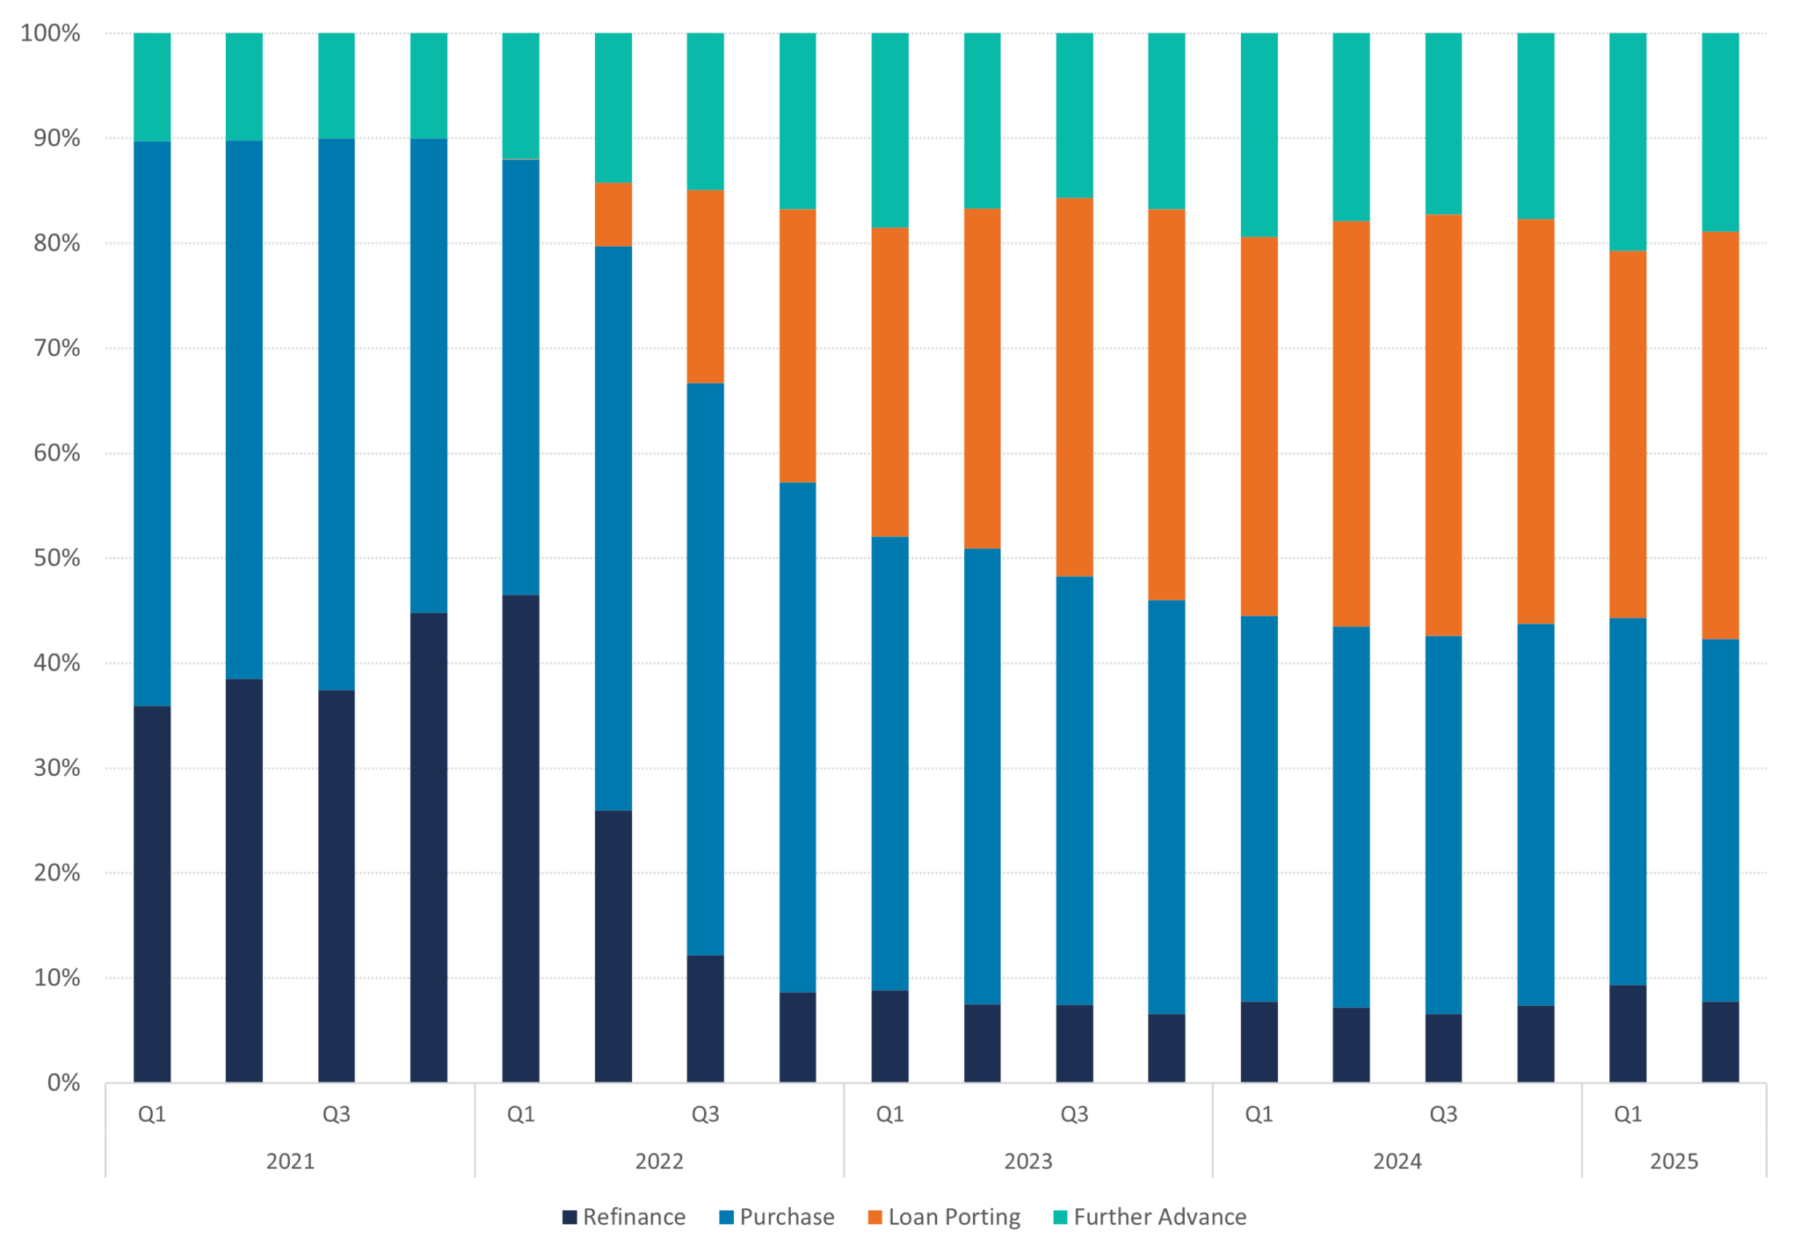
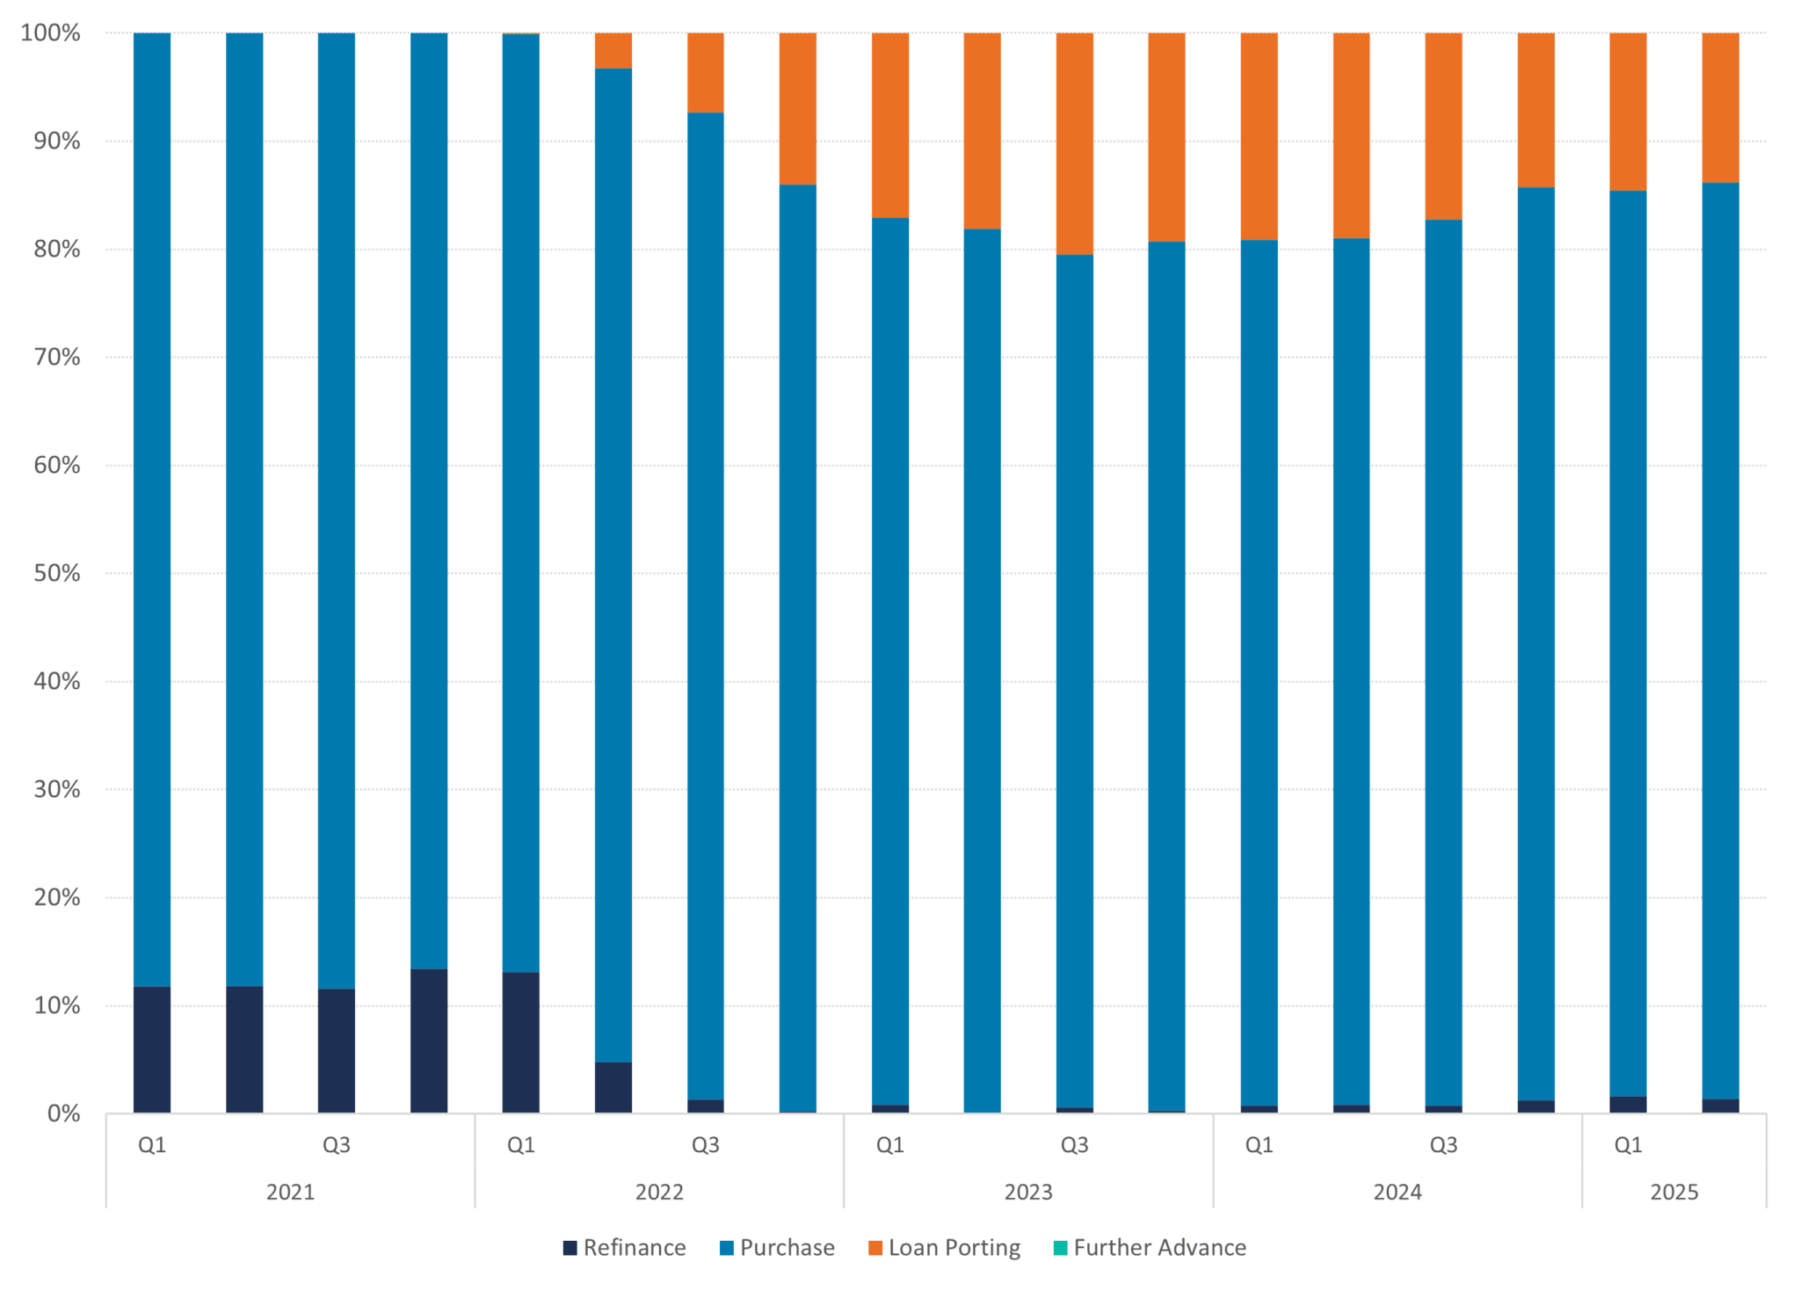
Figure 2: Mortgage applications per loan type (%)
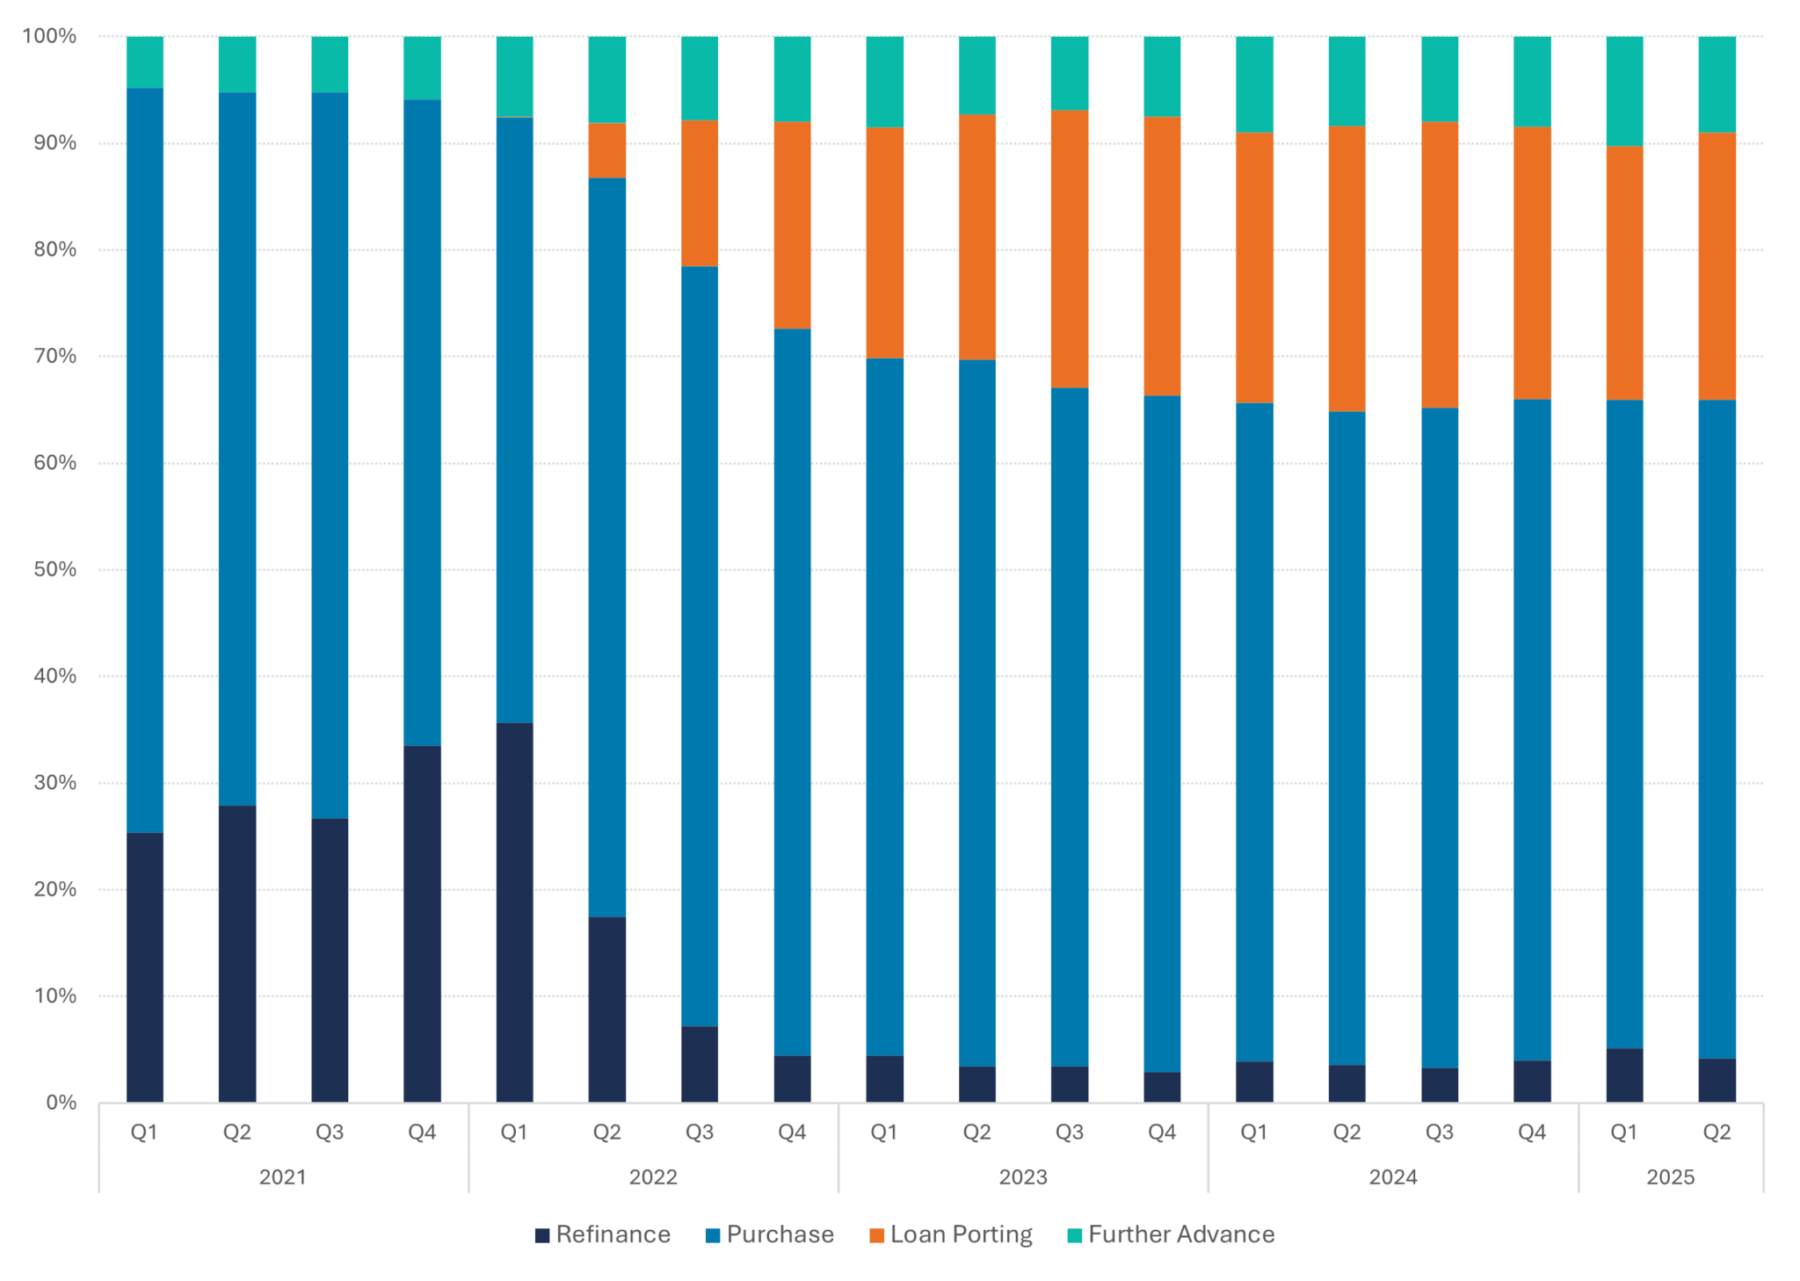
Source: HDN, DMPM analytics
Stabilization of loan porting applications
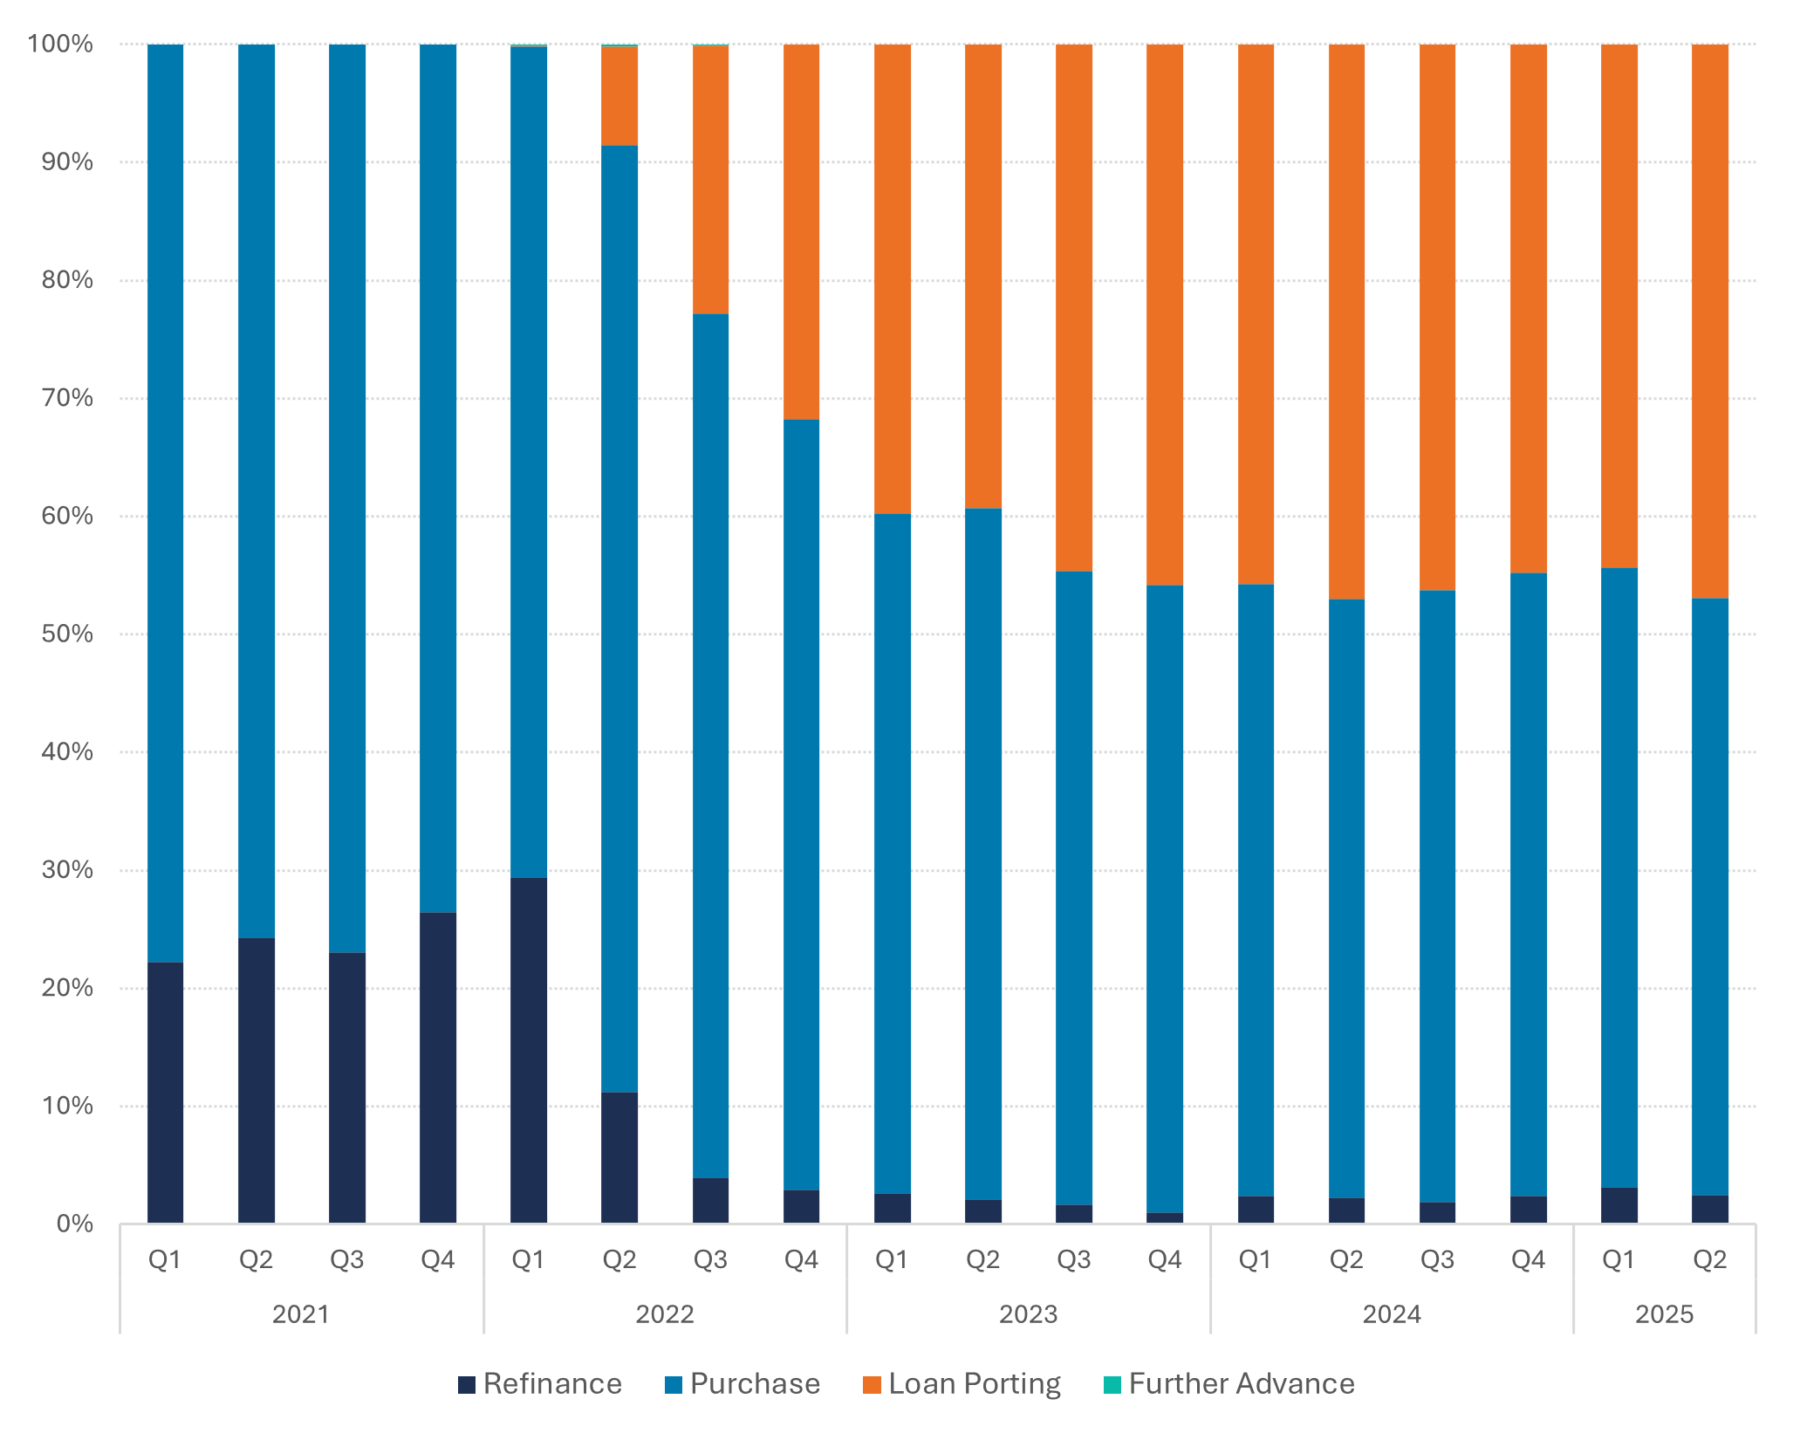
The share of ported loans in the purchase market seems to have stabilized just below 30%, breaking with the downward trend we mentioned in our previous quarterly update. A serious further drop in the portability market is not expected until 2026, ten years after the mortgage market bounced back from the poor years between 2008 and 2016 with very low origination volumes. Since 2016 most originated mortgage loans had 20Y+ fixed interest rates. After 2026 part of the mortgage portfolio will start having a remaining fixed interest period shorter than 10 years. As a result, consumers will then consider not to benefit from their portability option and prefer a new fixed interest rate term of 10 years +.
Figure 3: Applications for loan porting
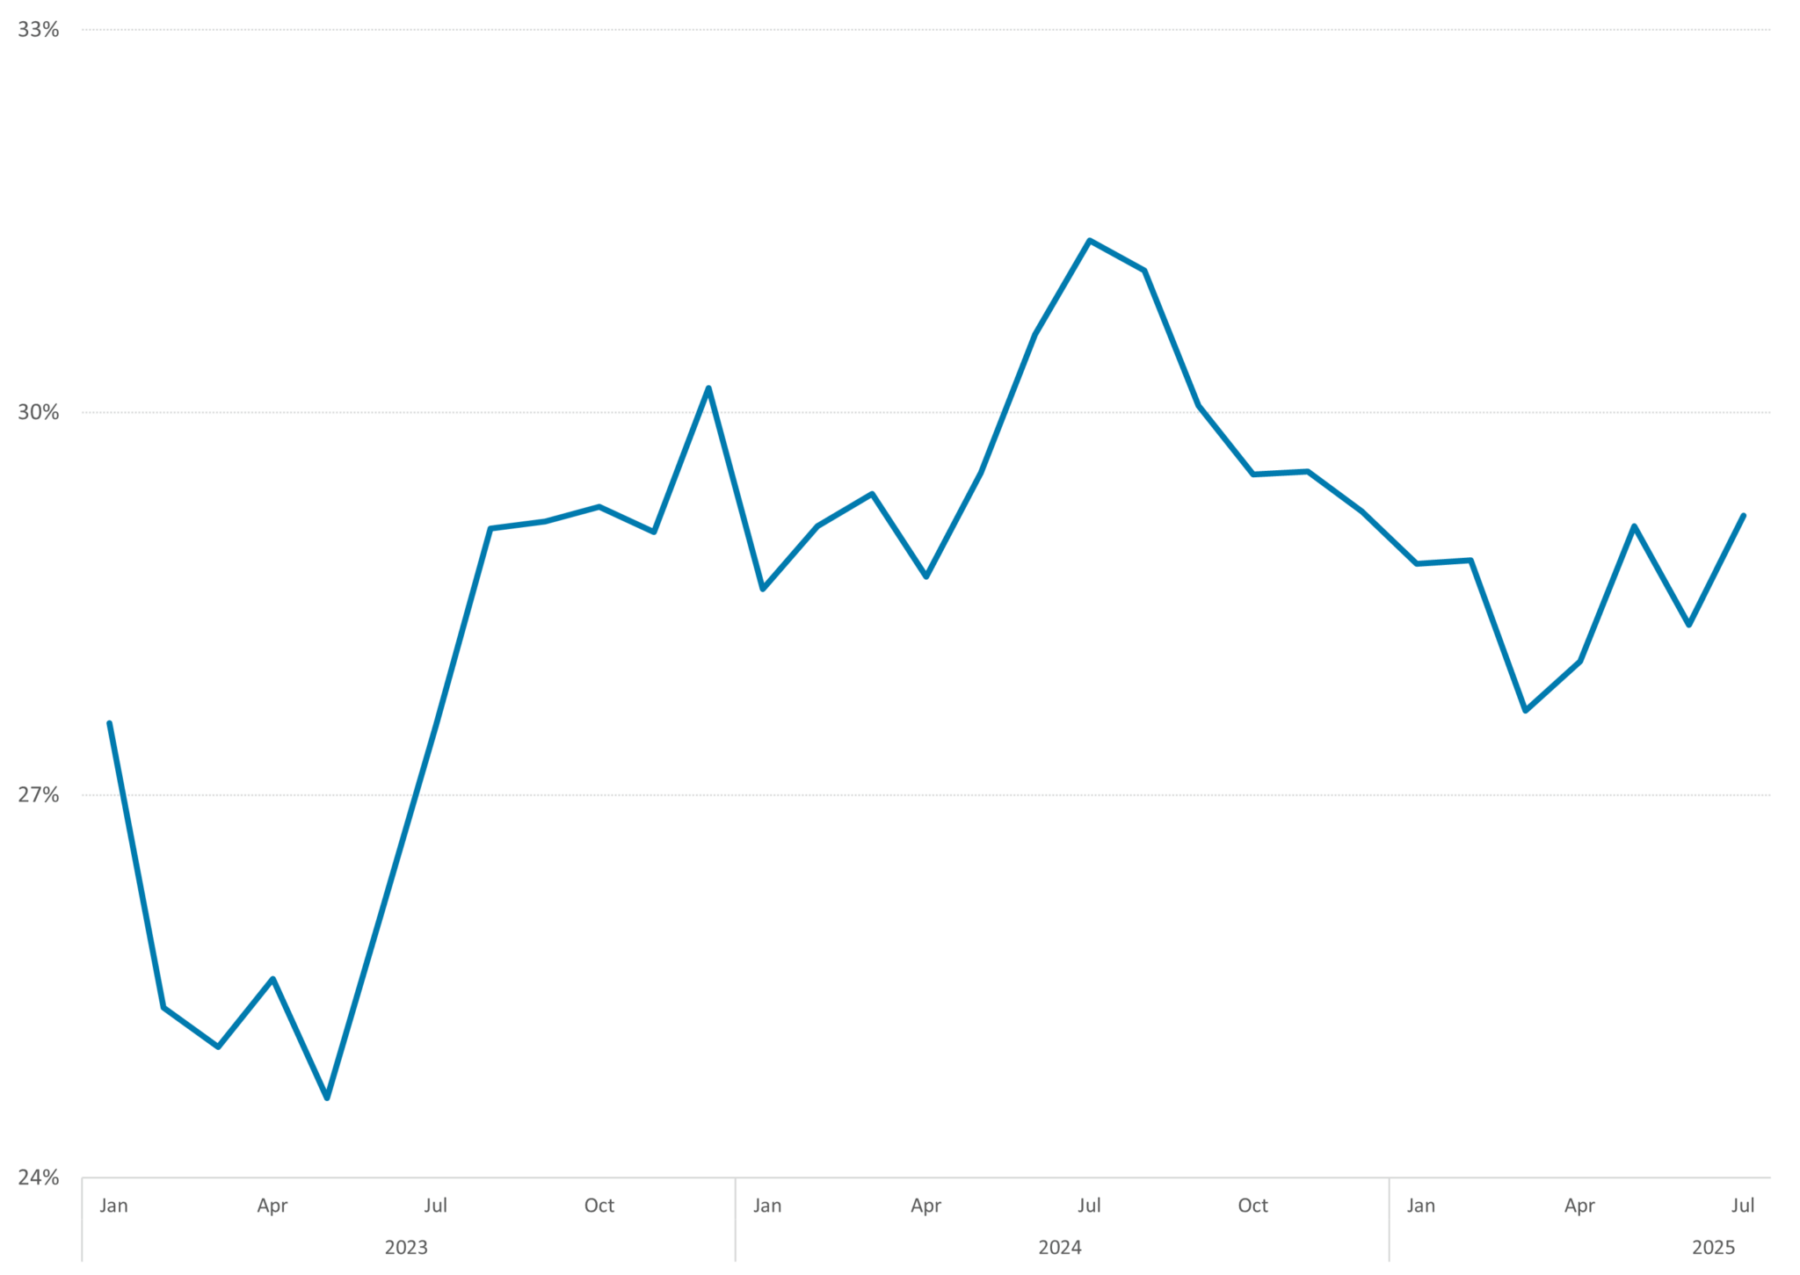
Source: DMPM analytics
Highest share of 0-10Y fixed mortgage rates since 2017
In the previous Quarterly Update we observed a gradual but slow increase of the market share of 20Y fixed mortgage applications. At 83% market share for the 0-10Y and 75% for 10Y fixed alone in Q2 ,this trend reversed resulting in the highest share of 0-10Y fixed in the past decade. Increased interest rates may be the reason for the market to return to shorter fixed interest rates.
Figure 4: Applications per fixed interest rate period (€)
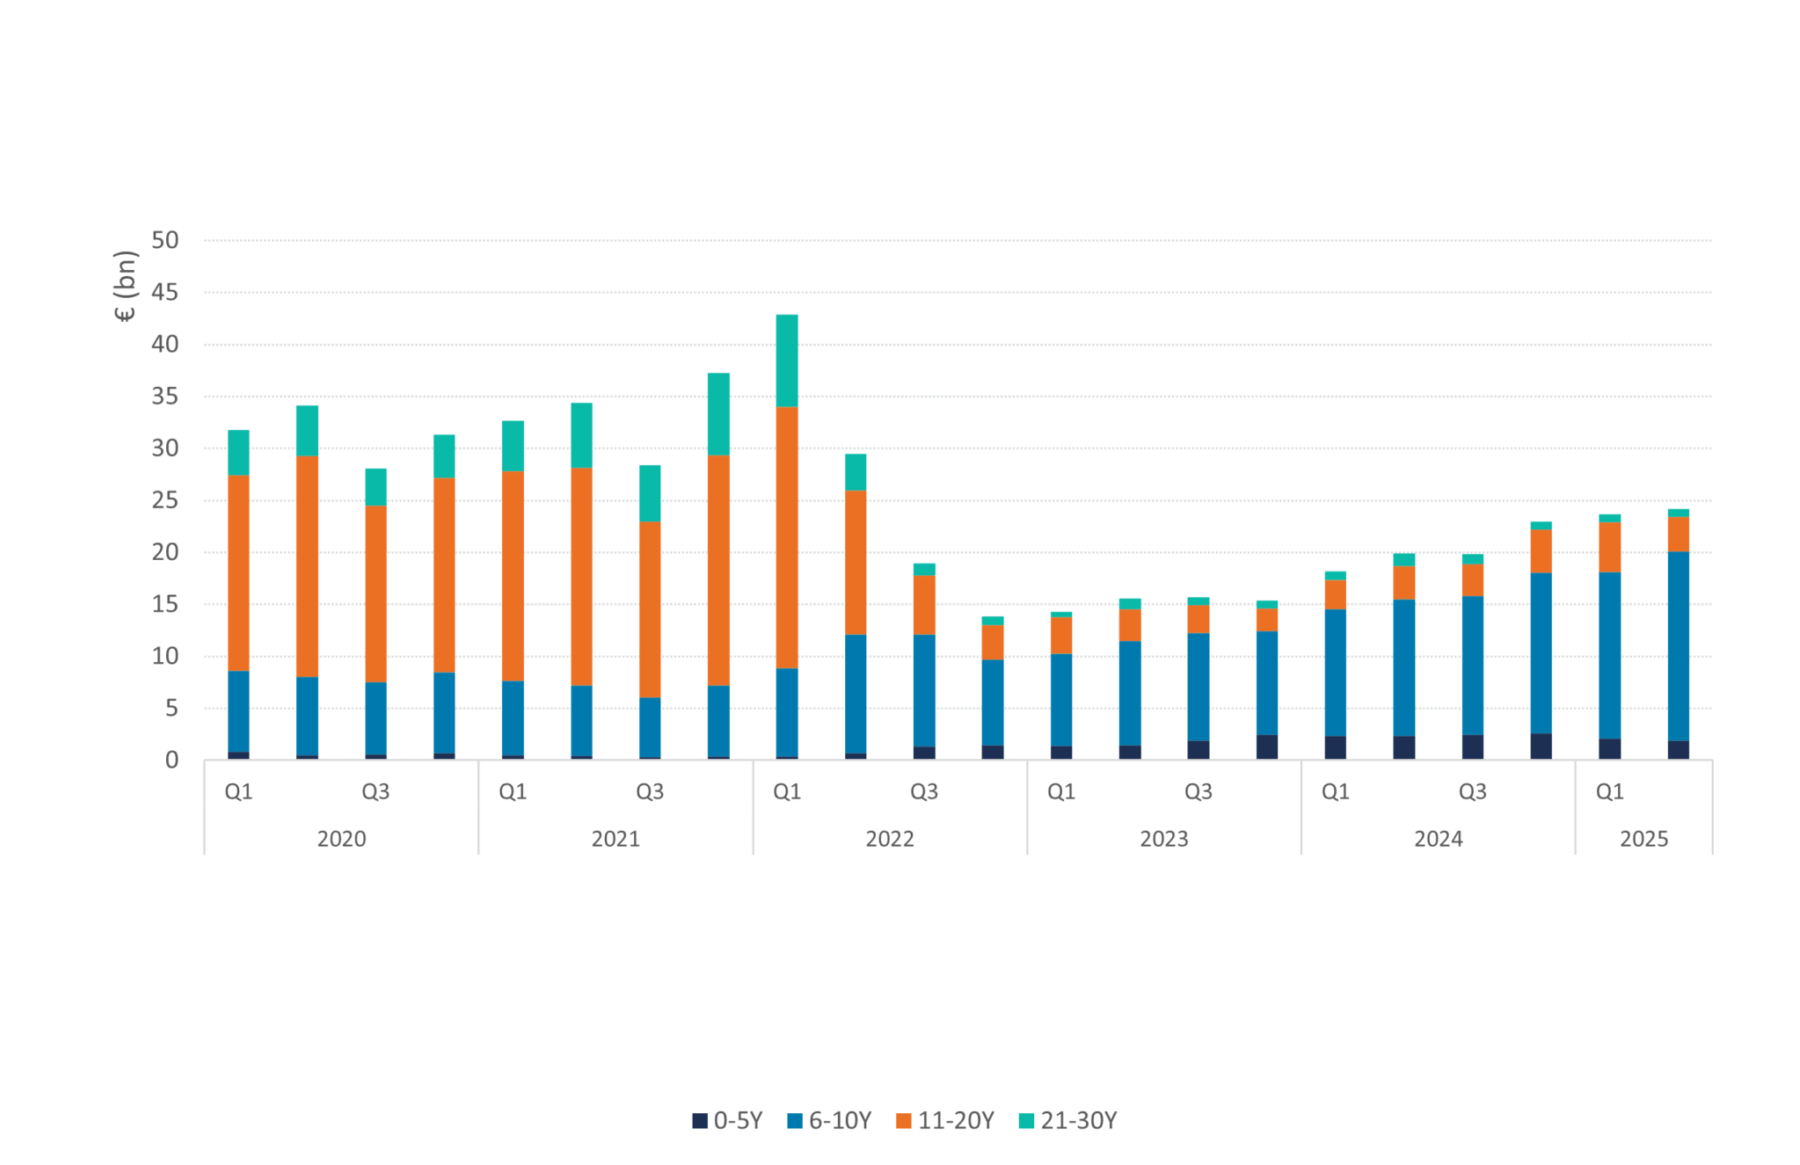
Source: HDN, DMPM analytics
Figure 5: Applications per fixed interest rate period (%)
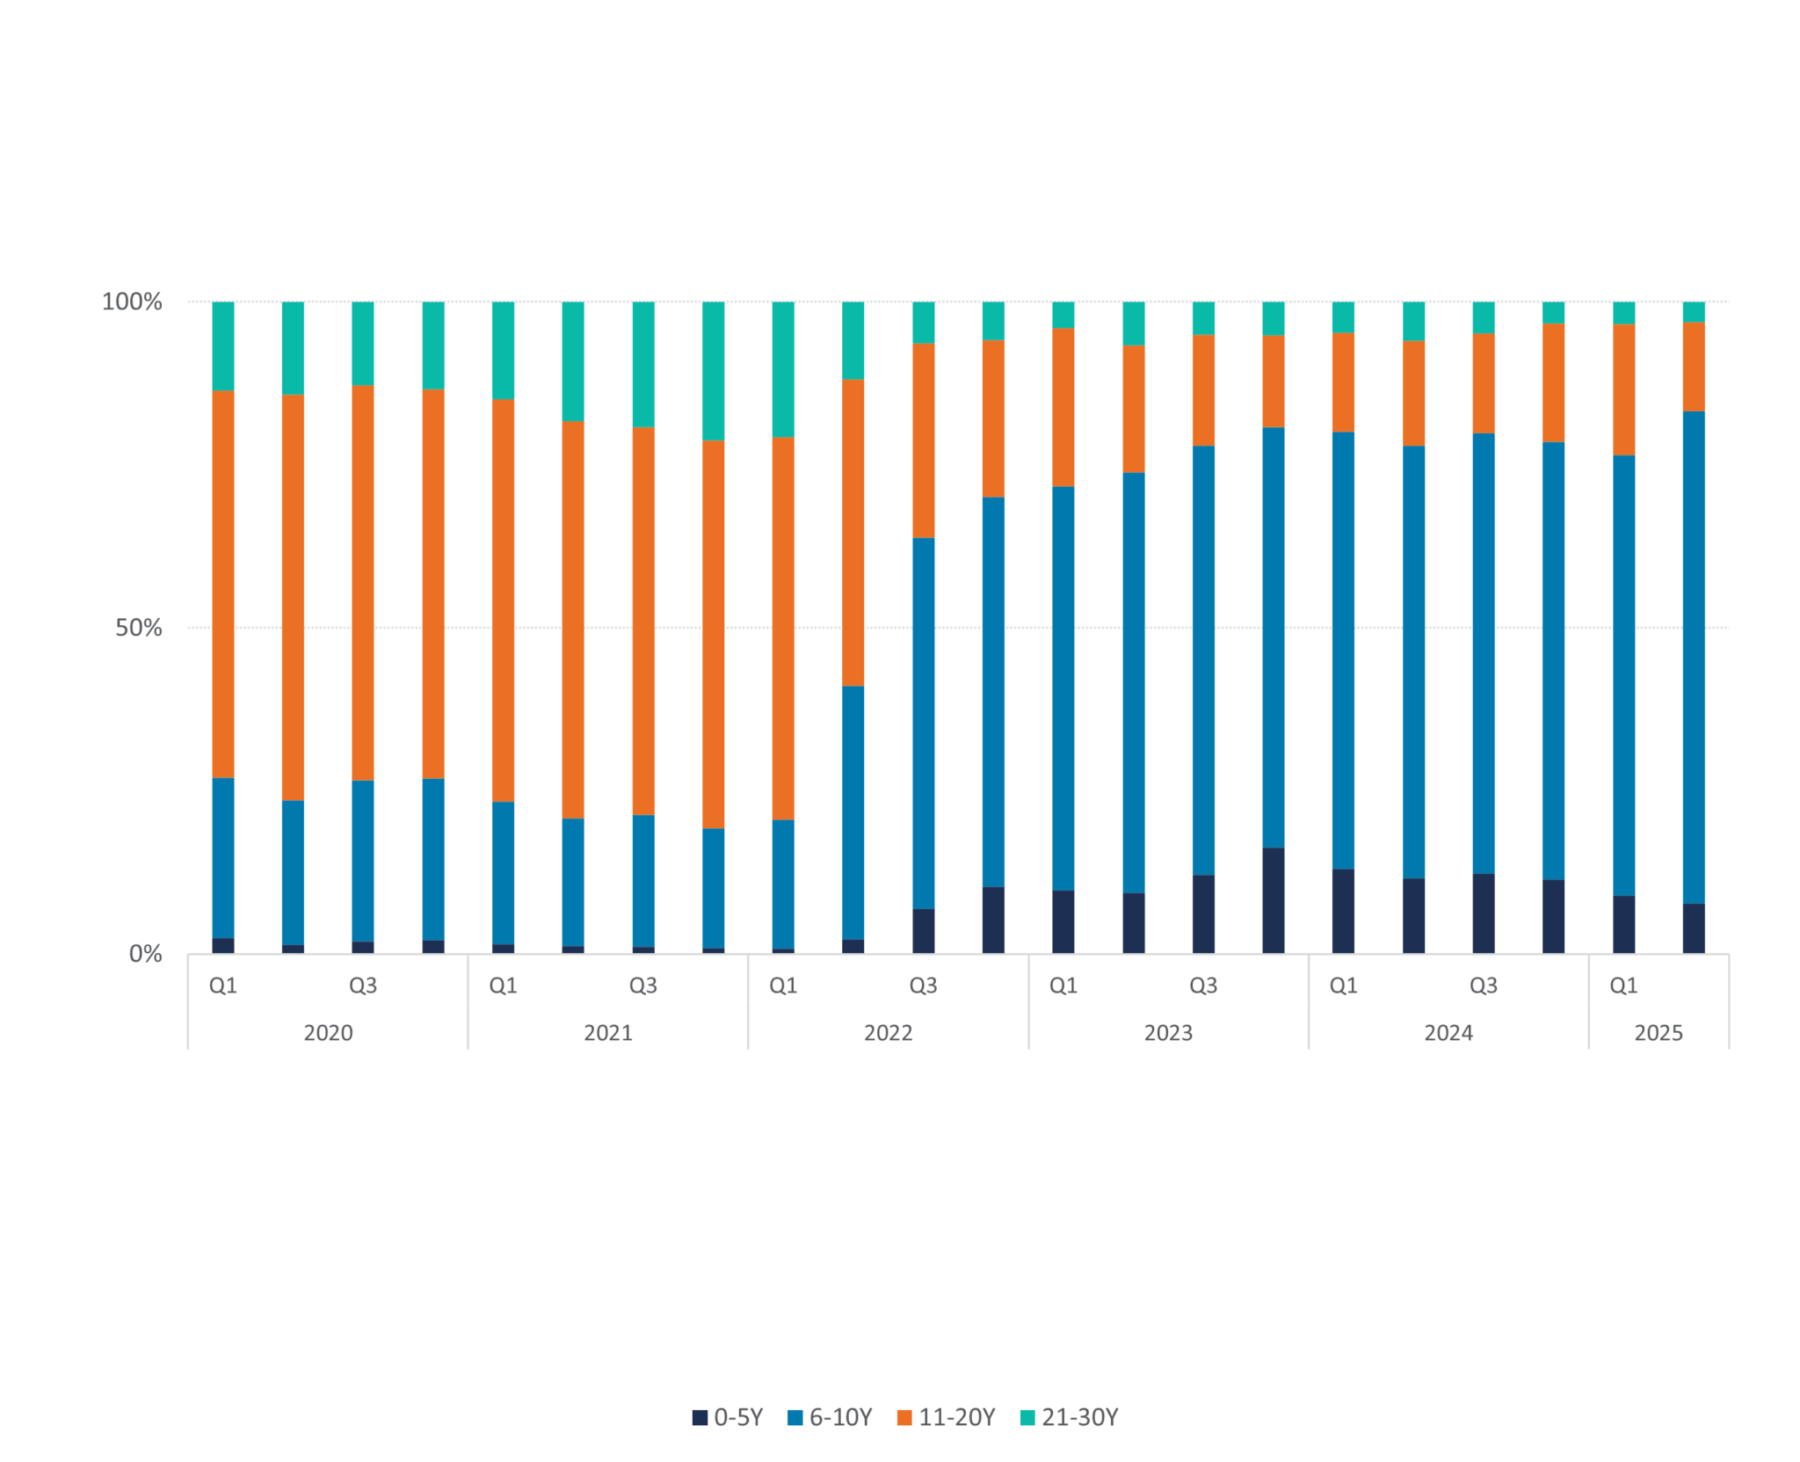
Source: HDN, DMPM analytics
Trends for various parts of the mortgage market: ported loans and further advances
Apart from the increasing size of the total mortgage market, the overall composition of the market hasn’t changed drastically in the past two years. If we take a closer look at the various parts of the market, several interesting observations lead to interesting conclusions.
The market share for portability (perhaps not surprising) is much bigger in the 0-80% LTV market (39%) than in the >90% LTV market (14%) or the NHG market (9%). As loan porting usually is triggered by moving to a bigger house, the maximum loan amount of NHG creates a ceiling and hurdle for portability with the benefit of NHG. As a result of equity in the old home which is used to buy the new property, LTV’s are typically lower for applications using the portability option. Overall it can be concluded that ported loans are more prevalent in the lower LTV segment of the market.
Another remarkable difference between the various risk segments of the market are the applications for further advances. In the market segments with an LTV over 80% we hardly observe any applications for further advances. Where in the lower LTV categories (<80%) further advances represent 19% of the market. Although borrowers have the option to increase the mortgage loan to 100% LTV after origination using a further advance, in practice this option is hardly ever used. Increasing property values and consequently borrowers automatically having lower LTV’s could be a factor for this, or consumers simply have become more risk averse and therefore want to limit their LTV. We can conclude this trend already exists since 2018.
Addressable market
The two factors mentioned in in the paragraph above, the market share of further advances and ported loans, influence the addressable per market segment. Both loan types represent modifications to existing loans and therefore these applications always remain with the present originator. If an investor is aiming for ramp-up of a new portfolio this part of the market should be considered non-addressable. Corrections on market size should be made to define the addressable market for each market segment. These corrections for each market segment are summarized in the table below. In the <80% market segment an 58% correction should be made.
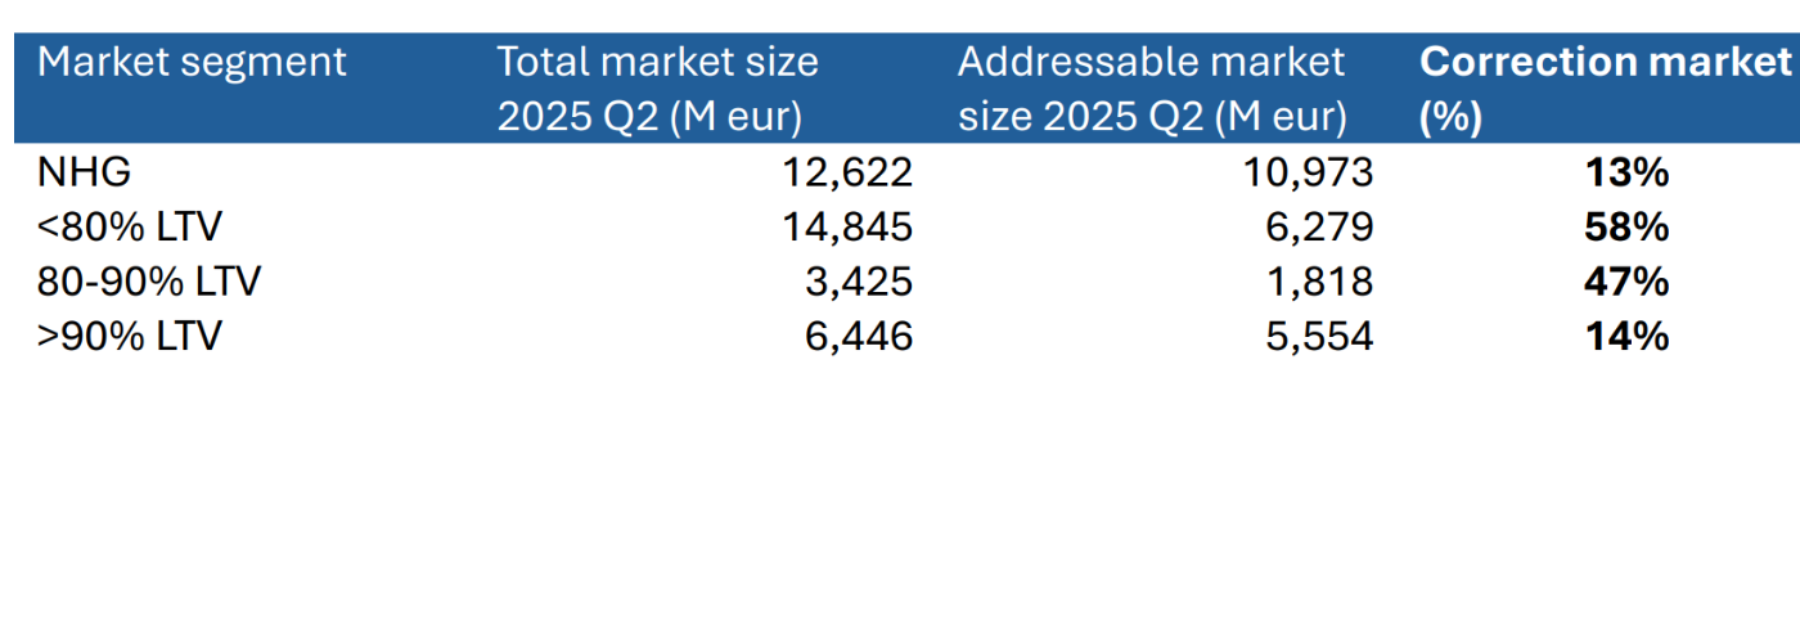
These numbers also indicate that the addressable NHG market represents 44.5% of the total addressable market, indicating that it is the ideal market circumstances for bank investors to ramp-up a portfolio, given the market size of NHG and fixed interest rates 0-10Y.
Figure 6: Mortgage applications per loan type (€) NHG
Source: HDN, DMPM analytics
Figure 7: Mortgage applications per loan type (%) NHG
Source: HDN, DMPM analytics
Figure 8: Mortgage applications per loan type (€) 0-80 %
Source: HDN, DMPM analytics
Figure 9: Mortgage applications per loan type (%) 0-80 %
Source: HDN, DMPM analytics
Figure 10: Mortgage applications per loan type (€) 80-90%
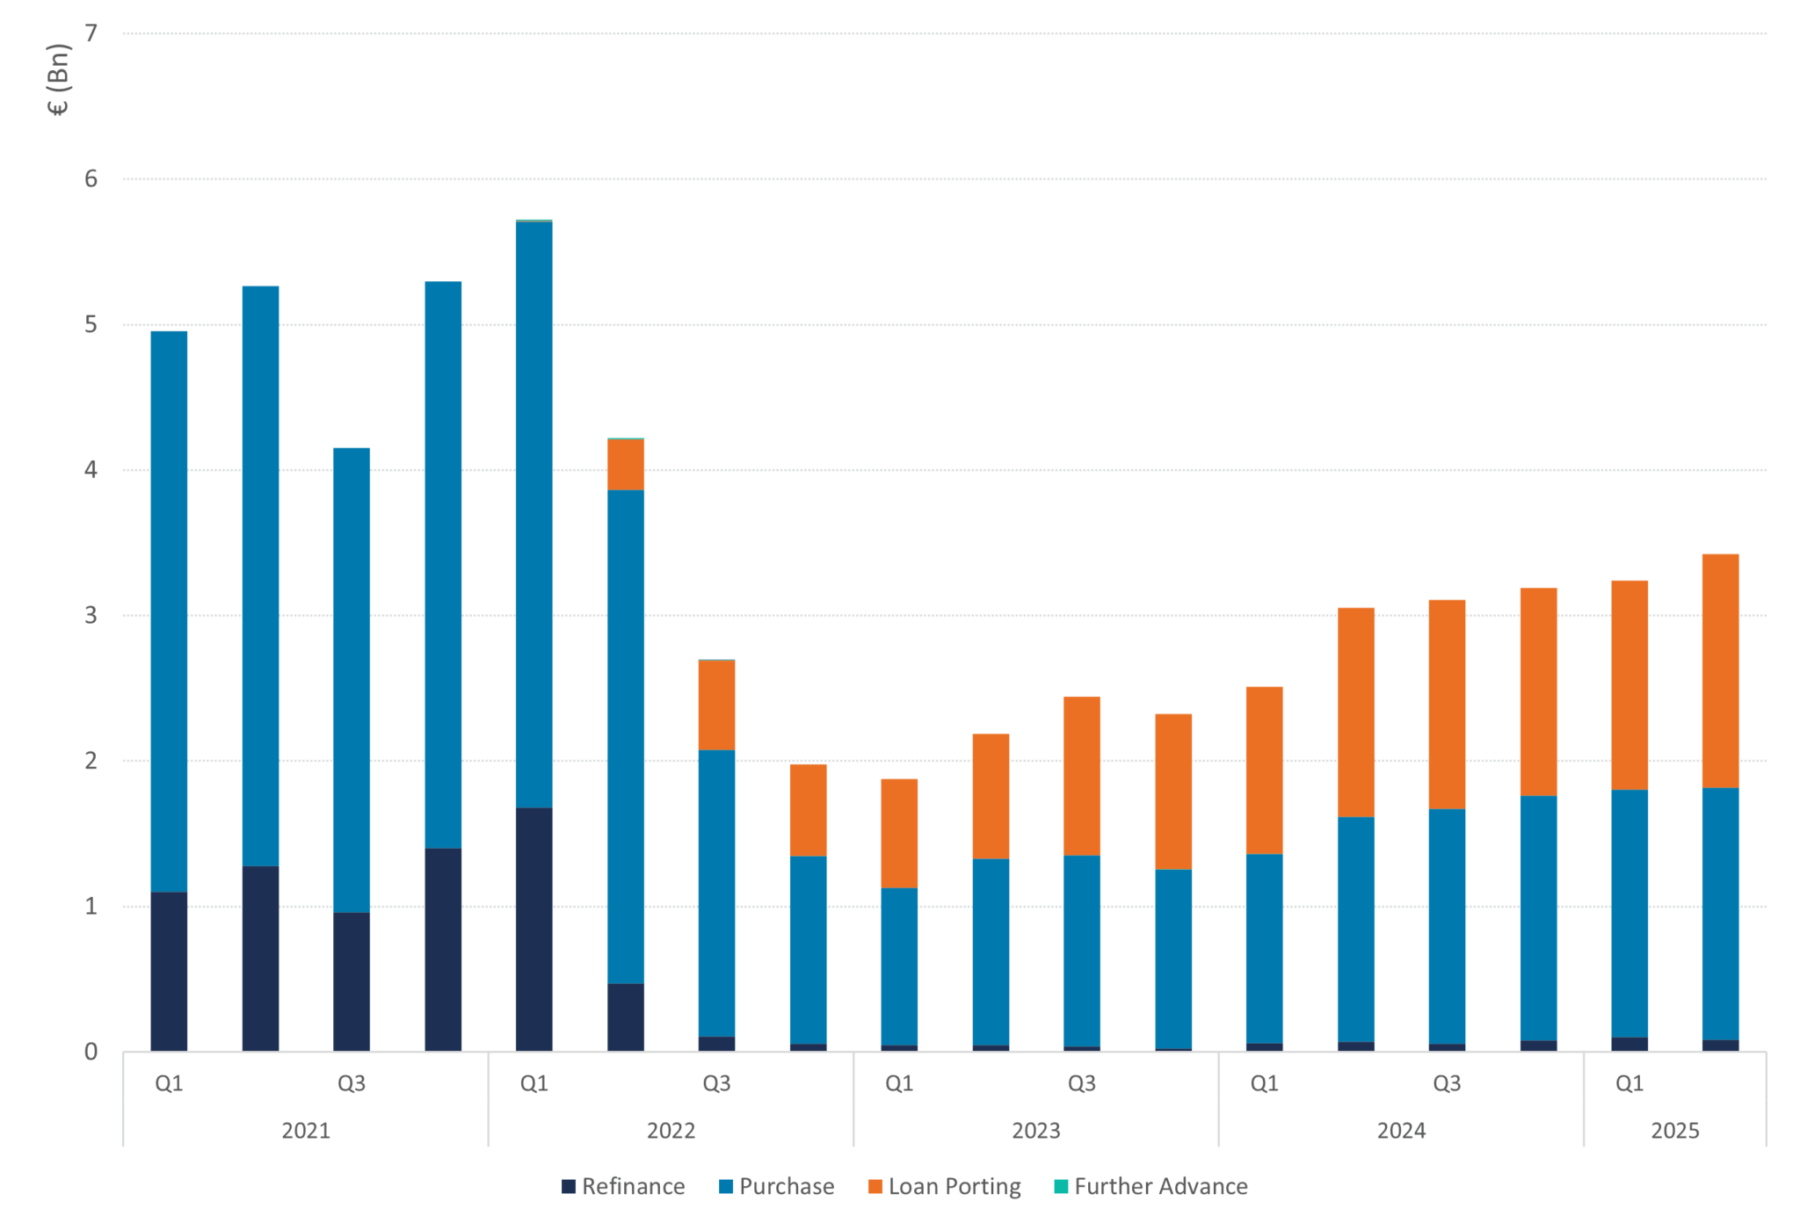
Figure 11: Mortgage applications per loan type (%) 80-90 %
Source: HDN, DMPM analytics
Figure 12: Mortgage applications per loan type (€) >90 %
Source: HDN, DMPM analytics
Figure 13: Mortgage applications per loan type (%) >90 %
Source: HDN, DMPM analytics
Want to know more?
For questions about this publication or about our services, feel free to reach out to Arno, the author of this article.