

- High market volatility driven by German spending plans and U.S. trade tensions.
- ECB rate cuts reflect concerns over slowing growth.
- Dutch outlook weakens as consumer confidence and GDP growth decline.
Market volatility: never a dull moment
Both the months of March and April were extreme in terms of volatility. On the 4th of March, Germany’s incoming coalition government announced €500bn spending plan focused on infrastructure and defense. In addition, a constitutional amendment was announced, making the defense budget unlimited for the foreseeable future. E.g. defense spending above 1% of GDP will not be limited by the German debt brake.
The recently elected chancellor Merz, made clear that wrt to defense spending, it is “Whatever it takes”. This famous phrase is something that everyone clearly remembers from a speech in 2012 of former ECB president Draghi during the euro crisis. Both the spending package and the constitutional amendment, resulted in the largest one-day sell-off in German government bonds since 1991 as the 10-year bond yield increased more than 40bp. Swap rates followed suit, but to a lesser extent. Dutch 10 year mortgage rates moved up 30bp in just a few days. During the month of April the U.S. tariff measures resulted in a significant flight to quality flows, bringing euro government yields back to February levels. Again, swap rates followed. Also mortgage rates declined, see figure below.
Figure 1: 10 Year NHG and Non-NHG mortgage rates
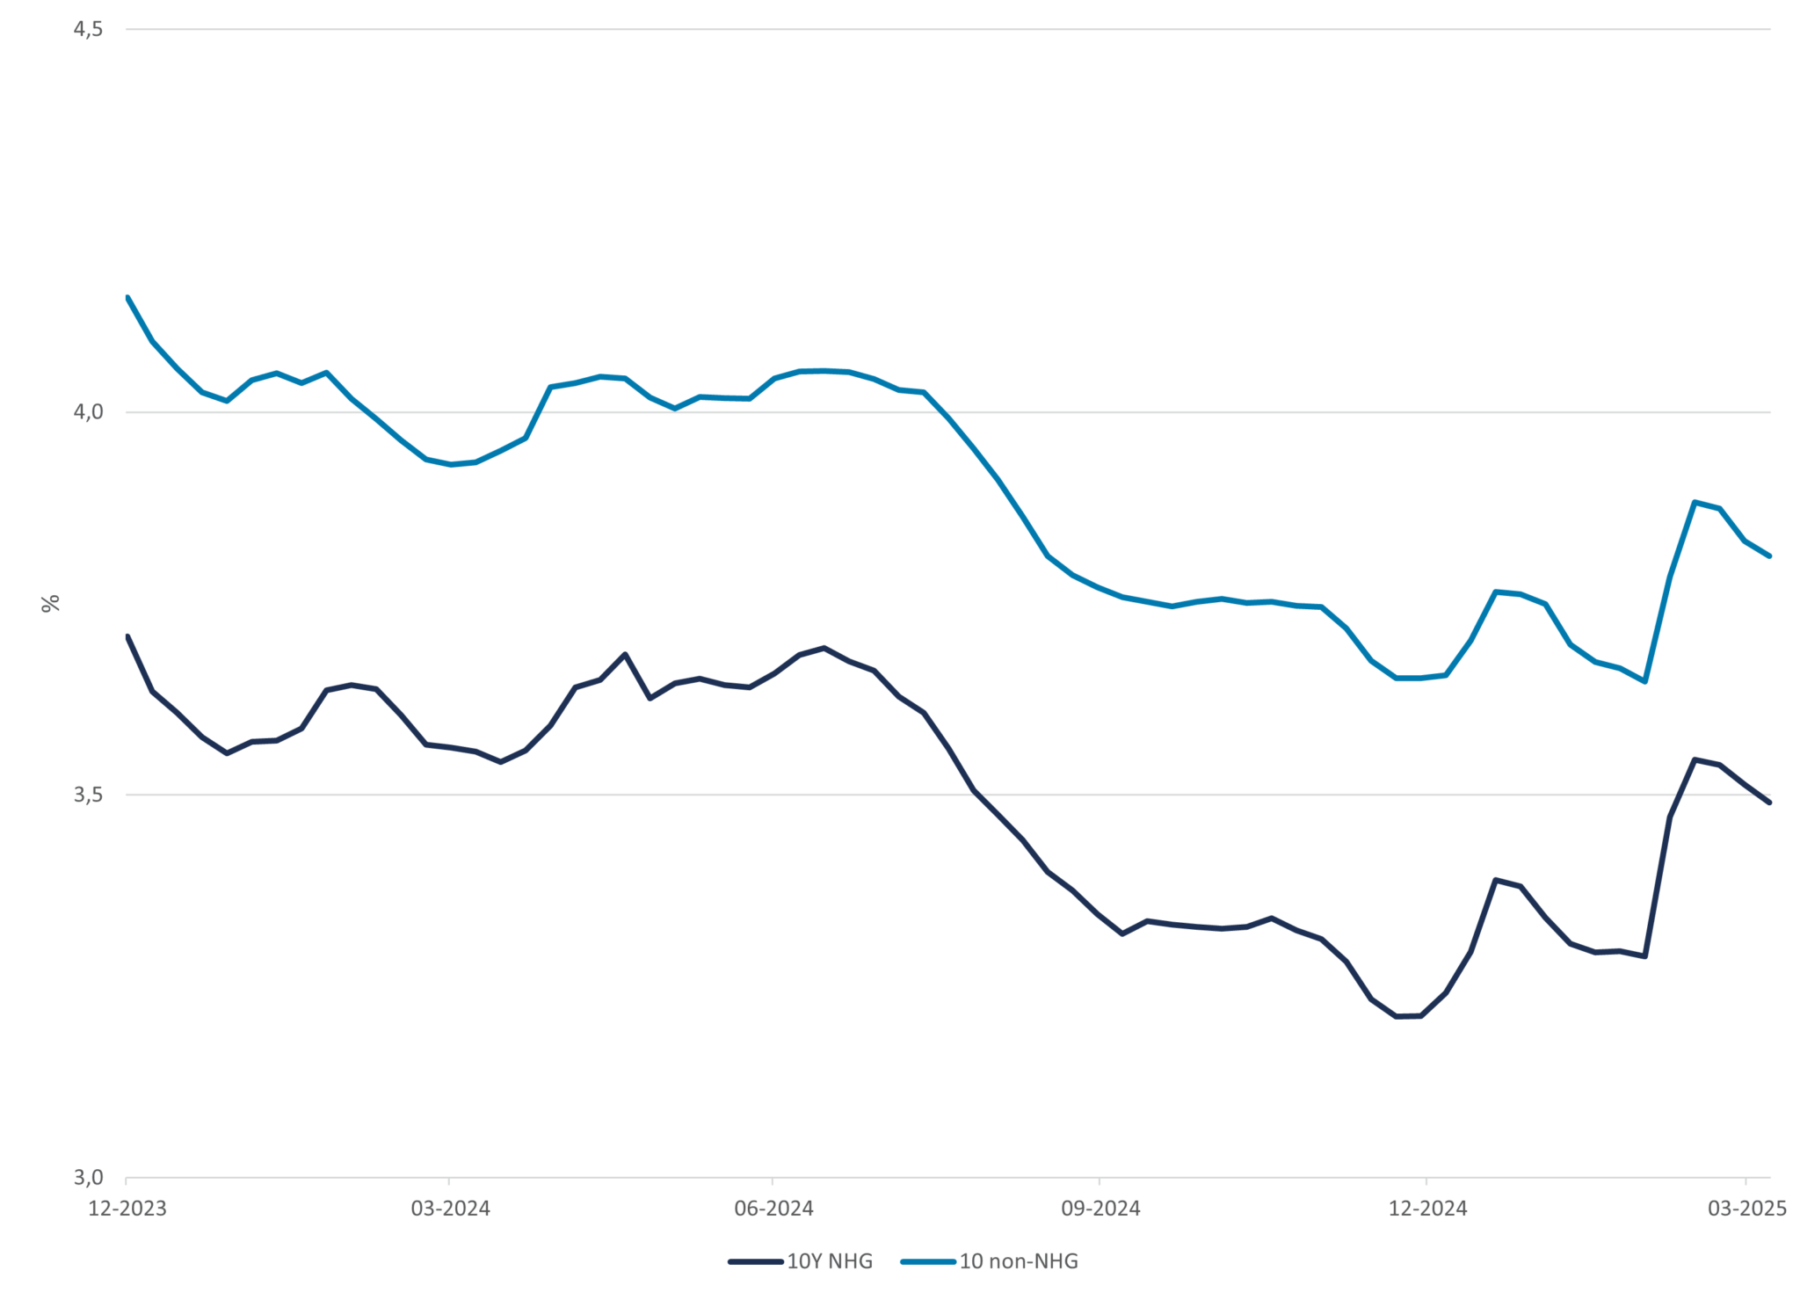
Source: DMPM analytics
ECB keeps foot on the peddle
During the first quarter the ECB lowered the deposit rate in two steps of 25bp to 2.75%, and continued with another cut of 25bp in April. Markets expect in June another rate cut of 25bp. Judging from the 3 months Euribor future of December 2025, the market prices four more cuts of 25bp before the close of the year to a deposit rate of 1.50%1 and also see figure 2.
Figure 2: Short term interest rate expectation for December 2025
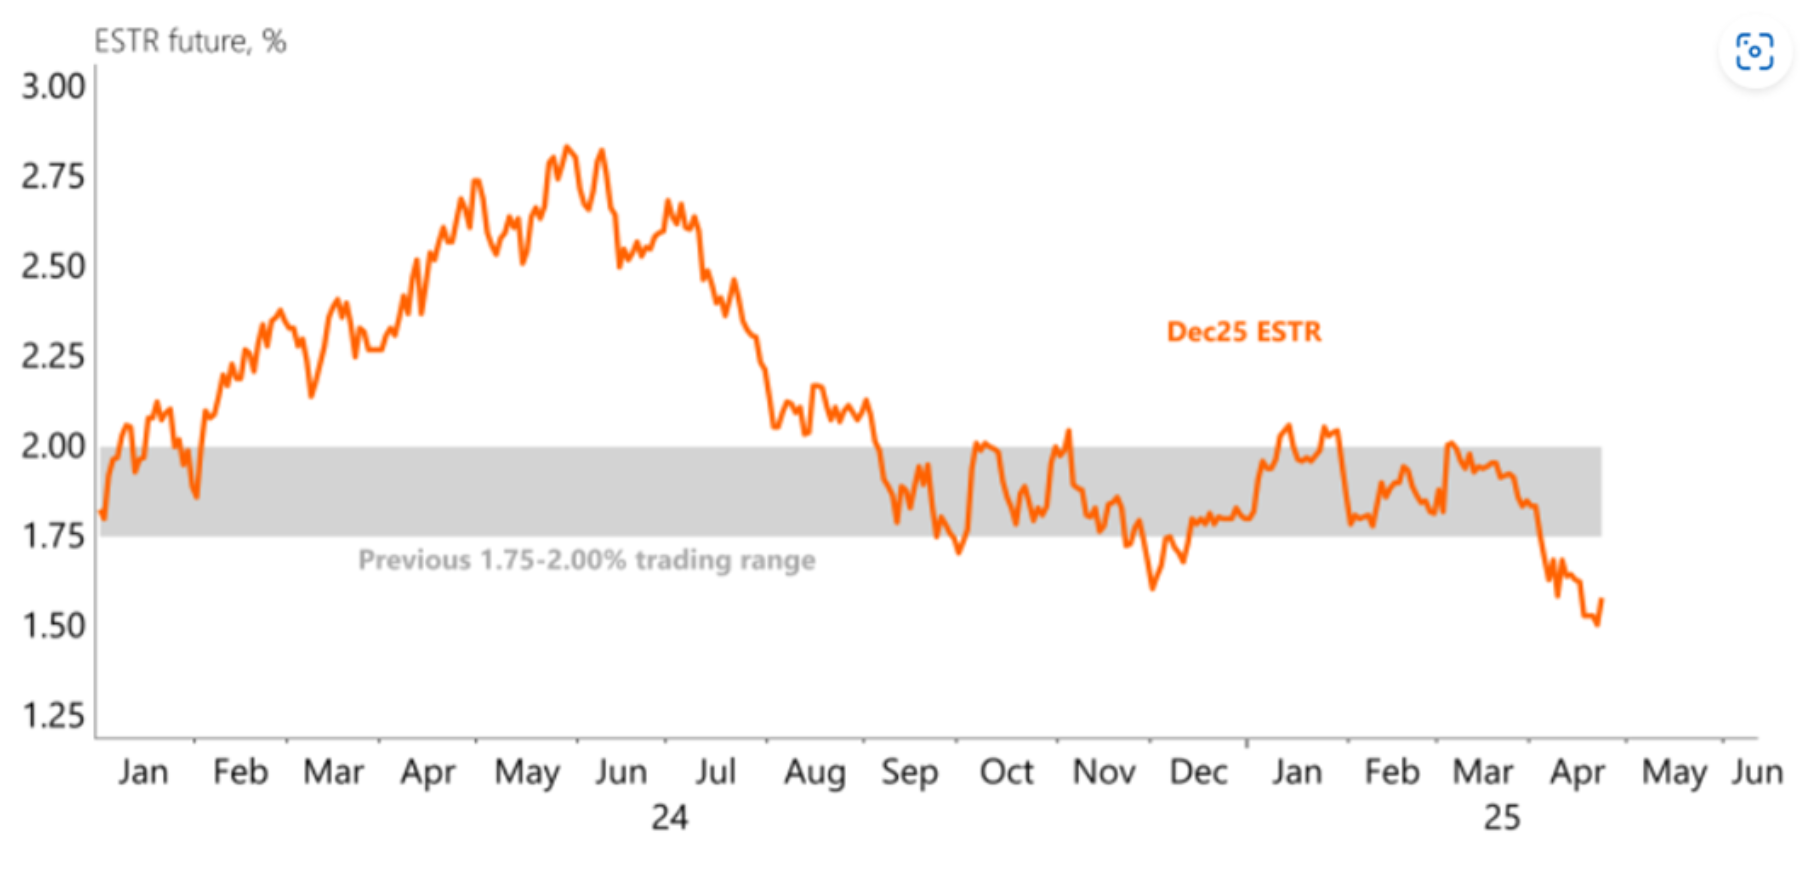
Source: ING, Macrobond
Judging from the April ECB meeting, the ECB is more worried about a slowdown in growth than a potential rise of inflation due to the U.S. trade war. For example, the ECB mentioned that “downside risks to economic growth have increased”. With espect to inflation the ECB made clear that the disinflation process is well on track, thereby referring to e.g. wage growth that is moderating. The latest reading of the euro area headline inflation is 2.2% and indeed close to the target of 2%. On future inflation the ECB is more or less undecided, given the current conditions of exceptional uncertainty. On one hand the trade war will likely result in higher inflation, but it could be claimed that due to the strong appreciation of the euro vs the dollar that the trade war impact on inflation will be dampened. In addition, lower economic growth will also result in a more moderated inflation number.
Lastly on the monetary stance. Up to the March meeting, the ECB included in their monetary policy statement that the monetary policy is (meaningfully less) restrictive. That phrase has been removed in the April statement. As the ECB is still expected to cut further this year, it would mean that the monetary policy stance will change to expansionary.
Curve steepening
Not only the market volatility was an important theme during the first quarter of 2025, also the significant euro swap curve steepening had a significant impact on the mortgage market. As figure 3 below shows, the 10-20 year swap curve steepened close to 15bp since the end of last year. At the start of the year the 10-20 year curve spread was close to 0bp and more than 5bp negative (inverse) in the second quarter of 2024.
Figure 3: 10 20 Y swap surve spread
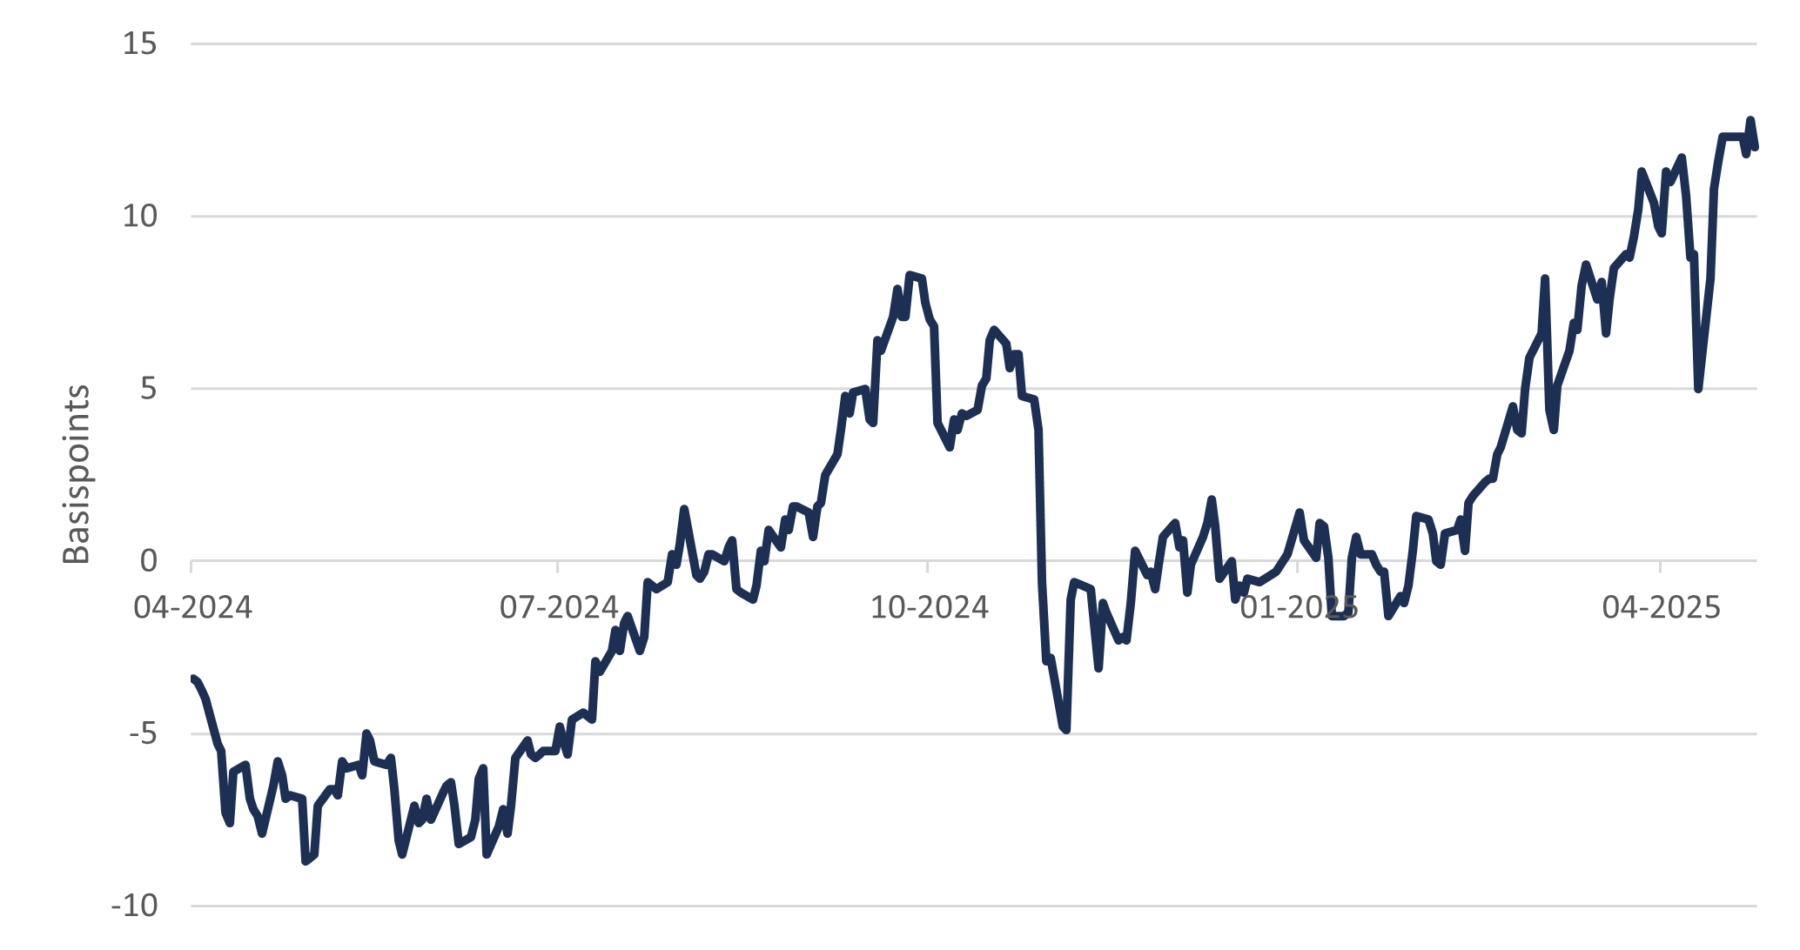
Source: DMPM analytics
Figure 4 below shows the steepening effect of the whole swap curve on two specific dates; at the beginning of January 2025 and on the 22nd of April. This way the effect of three rate cuts on the front-end of the curve can be visualized and also other effects that have likely impact on the long-end of the curve. And similar to the front-end of the curve, the long-end of the swap curve moved in the same direction as the long-end of the government bond curve.
Figure 4: Euro swap curves
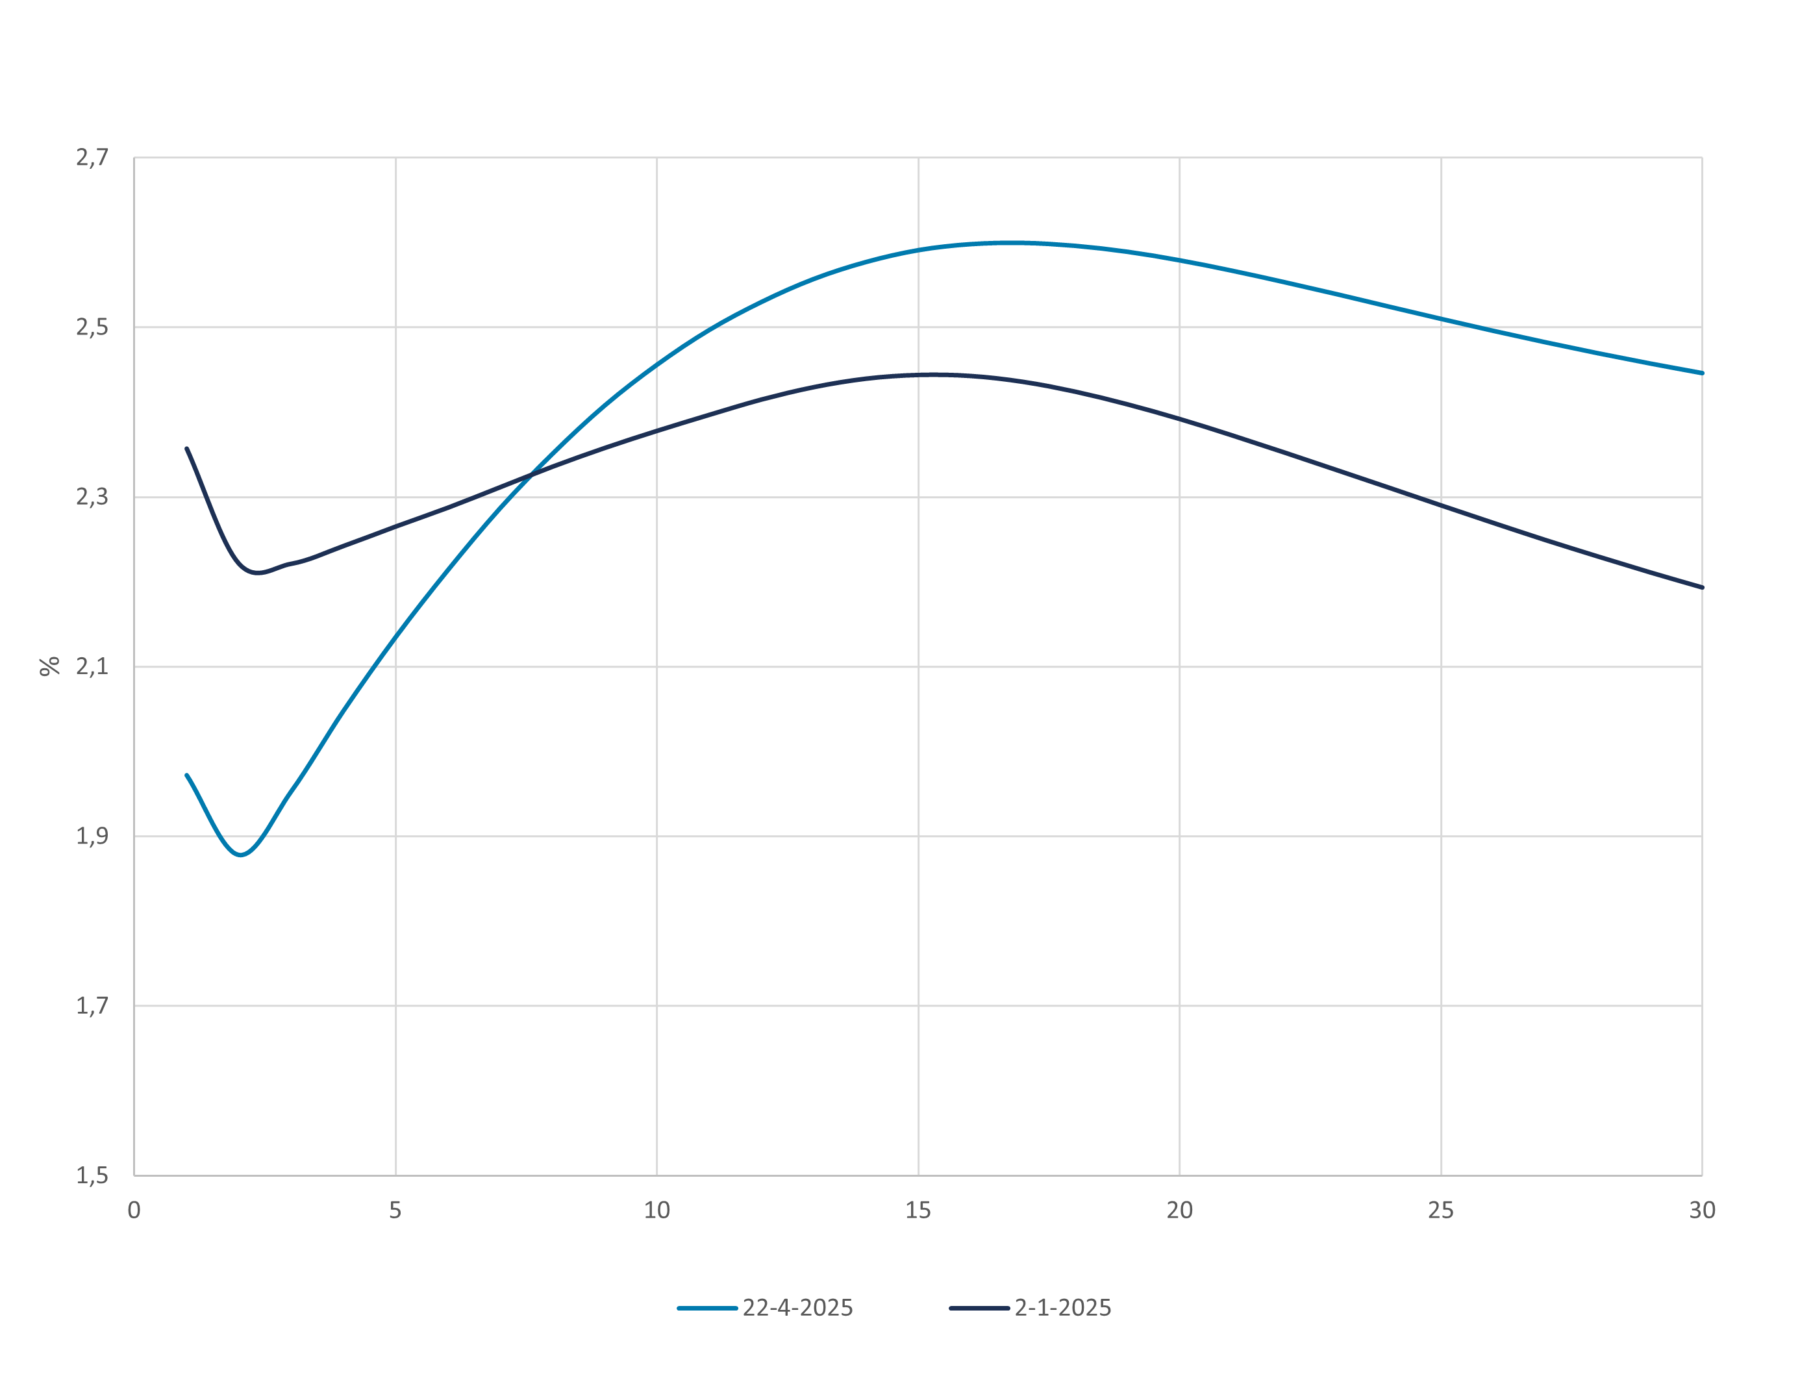
Source: DMPM analytics
The relation between the steepness of the swap curve and consumer preferences for certain fixed interest rate periods wrt to new mortgage applications, is fuzzy at best. But in the situation that the curve steepening continues, there is the possibility that shorter fixed interest rate periods are preferred. But more research is needed to draw a firm conclusion.
Dutch consumer confidence sinks
At the beginning of April the Dutch Bureau of Statistics published again a more negative consumer confidence number. It’s the seventh month in a row or lower confidence numbers, and the lowest since October 2023, see figure 5. Consumers are most negative about the economic outlook. In addition, consumers were more negative about their current and future financial situation.
Figure 5: Dutch consumer confidence
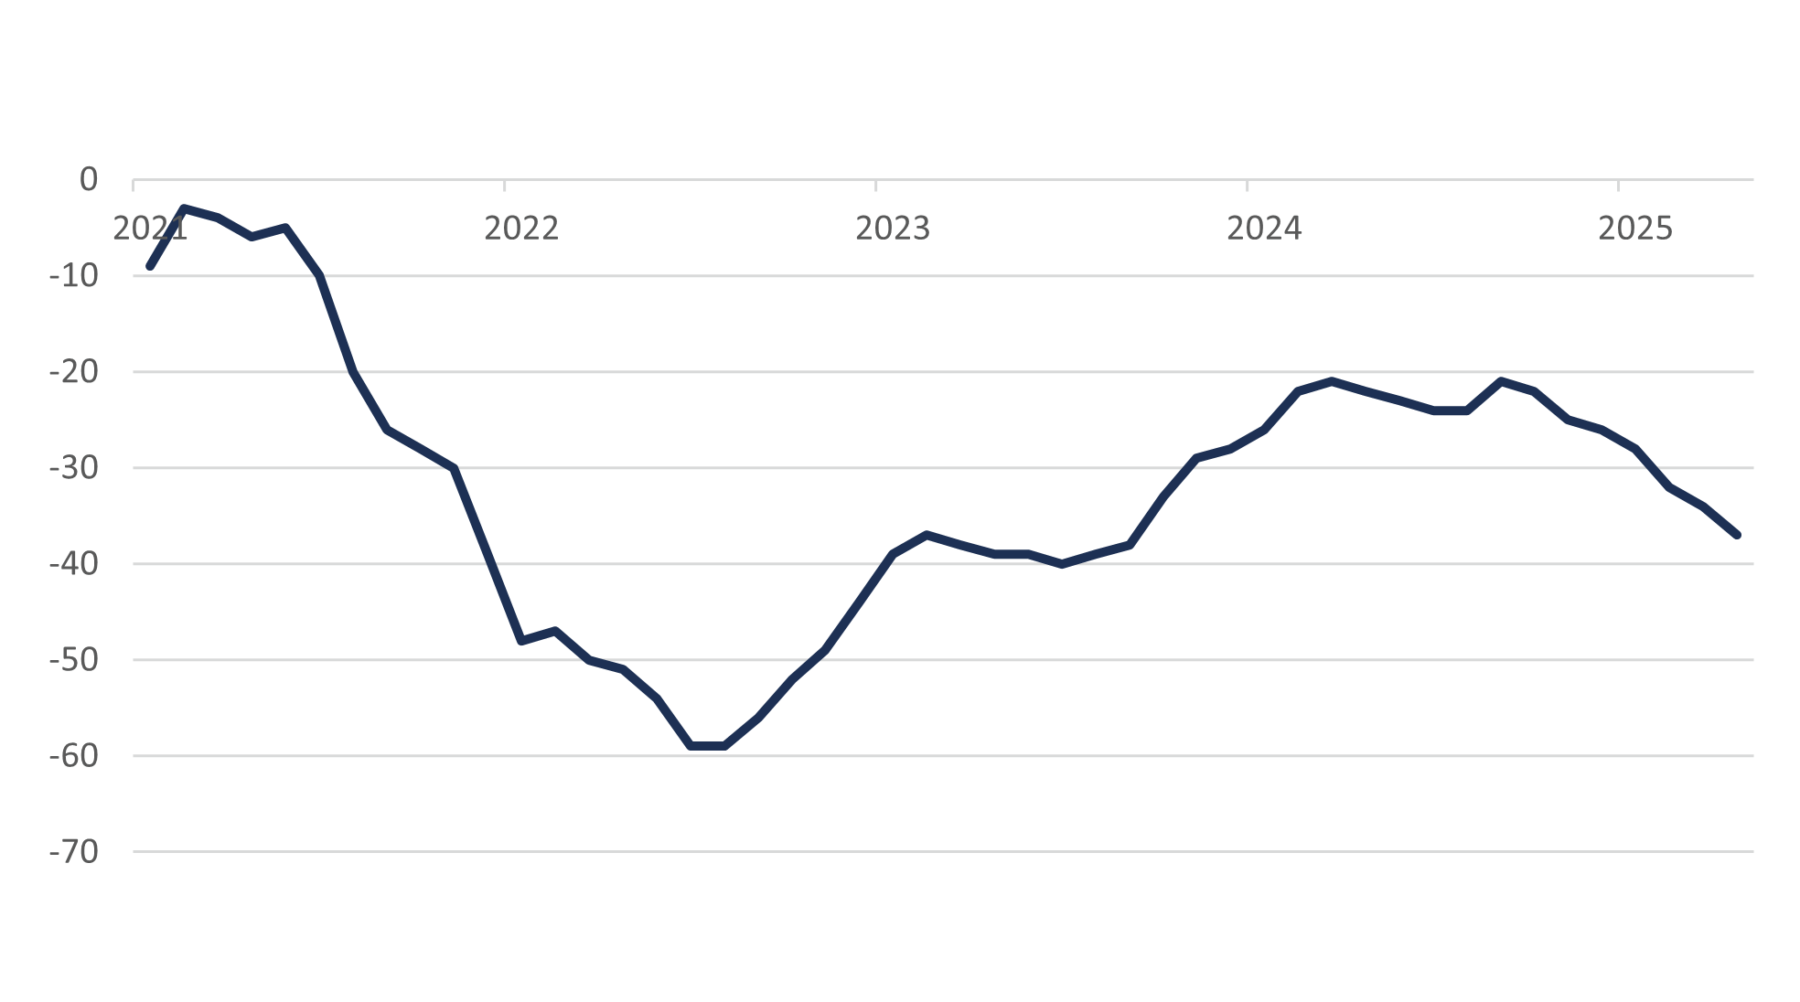
Source: Statistics Netherlands
Despite the more negative stance of consumers on their financial situation, the growth in real disposable incomes has been pretty solid. As figure 6 below shows, in the fourth quarter of 2024 the year on year growth was 3%. Meaning, adjusted for inflation disposable income still did grow substantially. The most recent inflation reading shows that inflation remains sticky at a high level, and is currently at 3.7%.
Figure 6: Real disposable income growth YoY
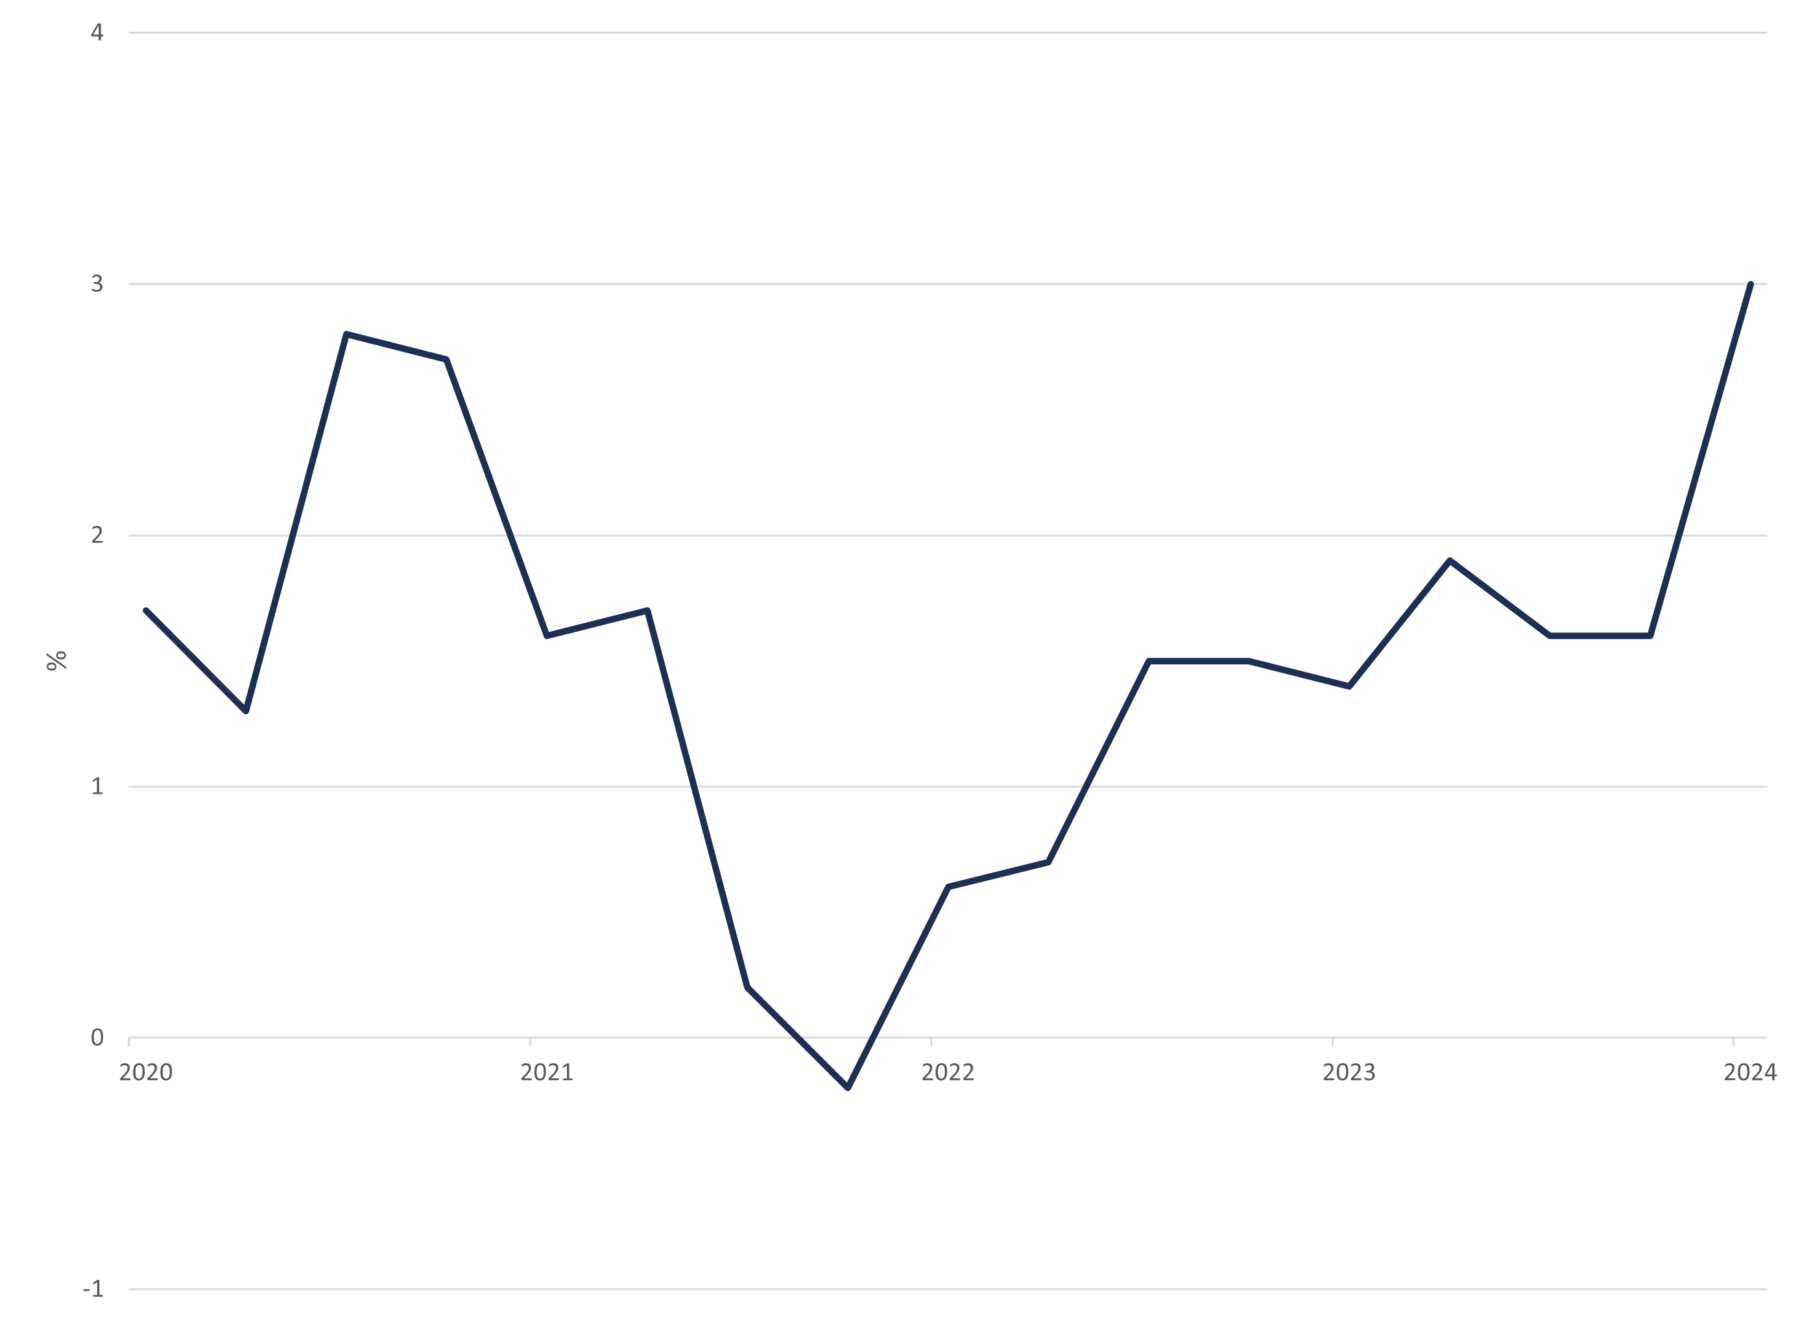
Source: Statistics Netherlands
Economic growth slowdown continues
The Dutch economy grew 0.1% QoQ in Q1 of 2025, a bit slower than the fourth quarter with a quarter on quarter growth of 0.3%. This is the third slowdown in growth since the second quarter of 2024, figure 7. If we look further to the components of GDP growth in the first quarter, than it becomes clear that the only contribution to growth was government spending. The growth in government spending was 0.5% compared to the previous quarter. Consumer spending, business investment and trade all had a negative contribution to growth in the first quarter of 2025.
Figure 7: Dutch GDP growth QoQ vs real GDP index
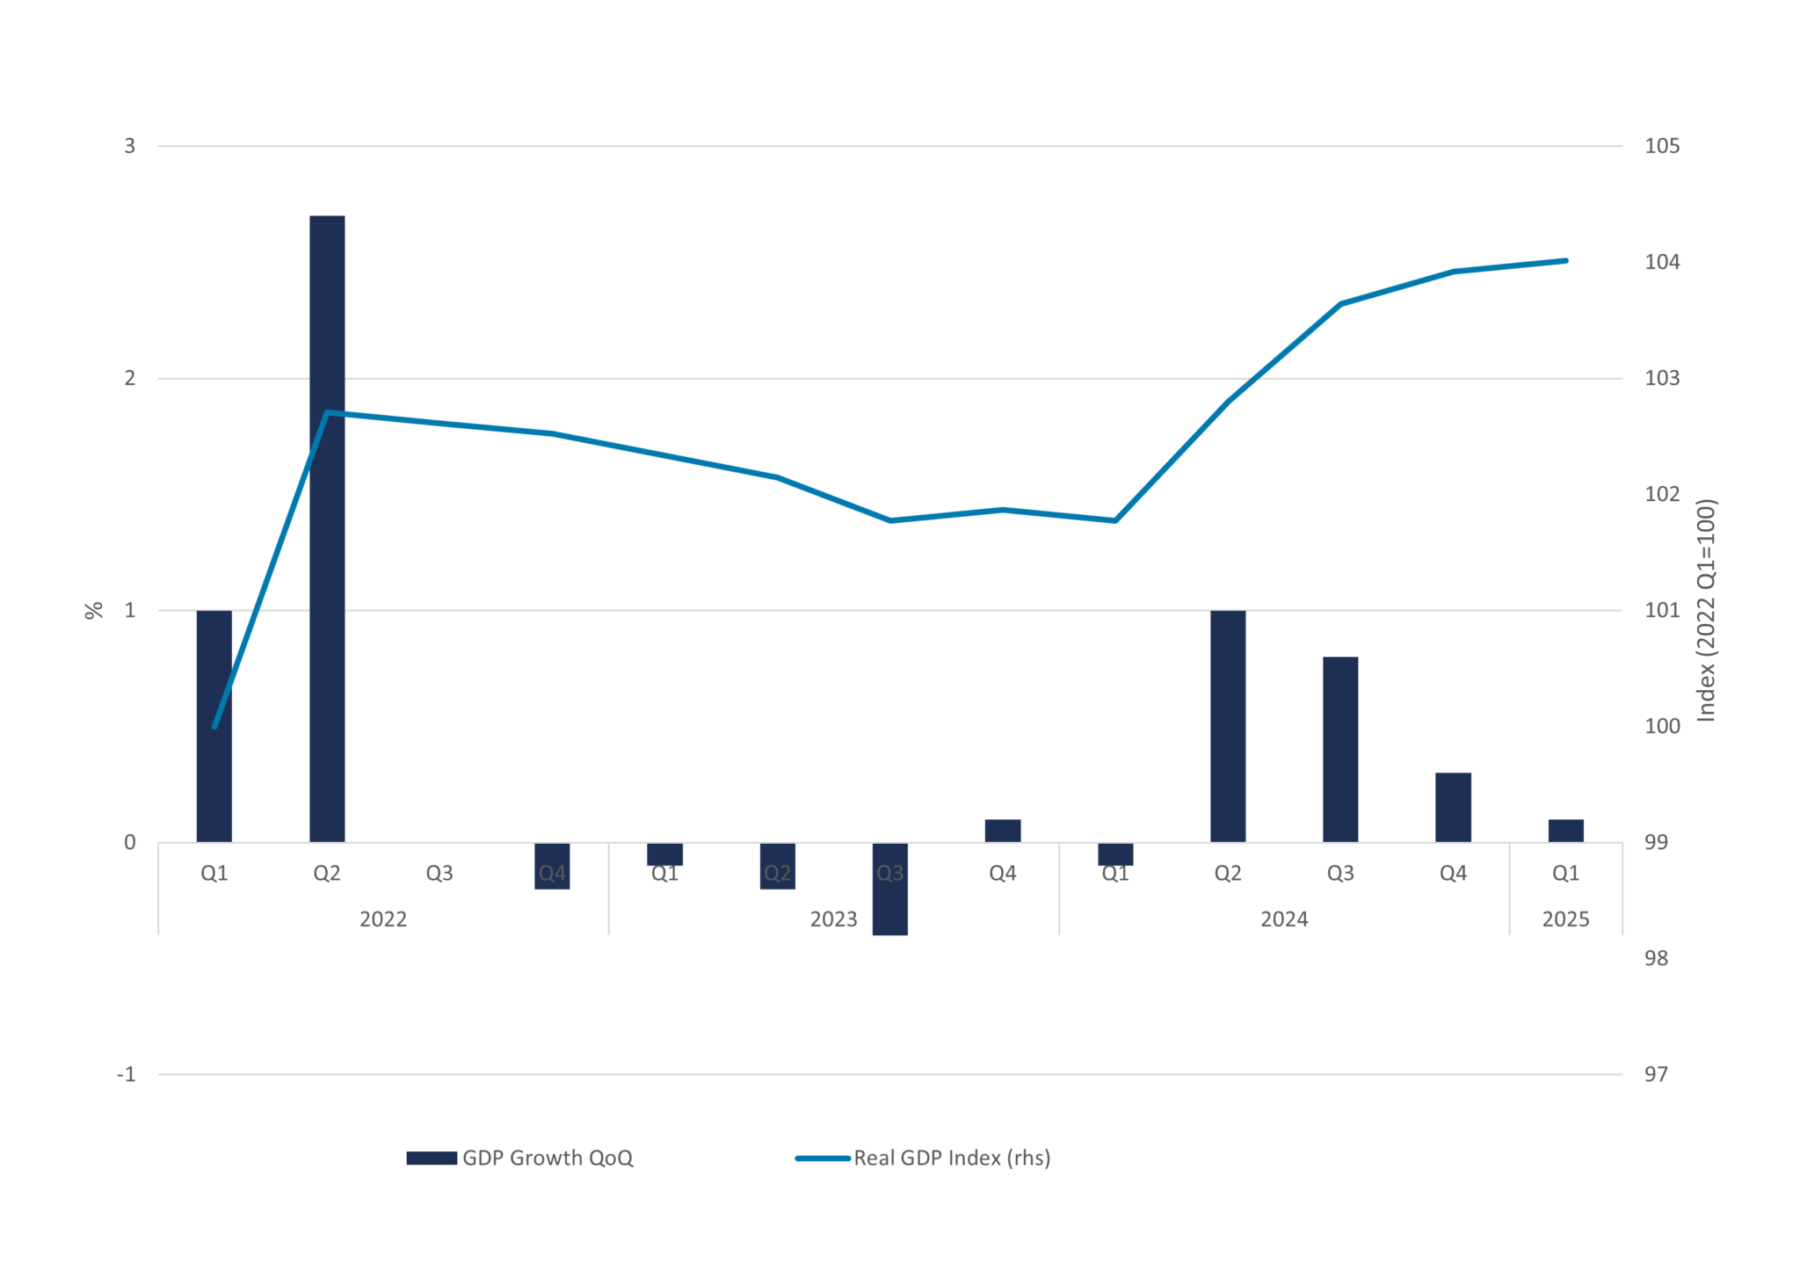
Source: Statistics Netherlands
In figure 7 above, cumulative growth since the first quarter of 2022 is visualized via the real GDP index time series. In the first half of 2022, growth was relatively strong. But starting from the third quarter of 2022 up to the first quarter of 2024 growth was very close to zero. Growth picked up in 2024 in the second quarter and remained positive up to the first quarter of 2025, although marginally positive in the first quarter of 2025. The current conditions of exceptional uncertainty will likely have a negative impact on both consumers, business investments and trade. A further slowdown in growth in 2025 is therefore likely.
Footnotes
1] Calculated as: 1 – future price (t)
Want to know more?
This article is the first chapter of our quarterly market update for Q1 2025. In this report, we outline developments in the Dutch economy, the housing market and the mortgage market.