

- House price growth slows for the first time since 2022
- Northern regions outperform major cities in price increases
- Market remains tight despite more supply
During the third quarter of 2025, the trends we addressed in the previous quarterly reports regarding the housing market have continued at a steady pace. The effects of the in 2024 introduced Affordable Rent Act remain evident, while house prices have reached a new all-time high again. As the Netherlands approaches the upcoming elections, uncertainty surrounds the future direction of national policy. We continue to closely monitor the housing market and the new developments expected to emerge shortly after the elections.
Housing prices seem to stagnate for the first since 2022
NVM reports that home prices in the Netherlands increased in the third quarter of 2025, with prices rising 4.8% year-on-year. We conclude that the price increases are slowing down slightly. The average transaction price was € 496,000 during the third quarter which shows us that crossing the € 500,000 threshold will have to wait a little longer. The figures of the Statistics Netherlands confirm this observation by the NVM, the graph below shows a slight increase Q-o-Q but if we compare August (151.6) to September (151.6), the housing index remains the same. Please keep in mind that the increasing proportion of smaller and less expensive available houses as a result of the Affordable Rent Act has a delaying effect on the rate of price growth.
Figure 1: House prices
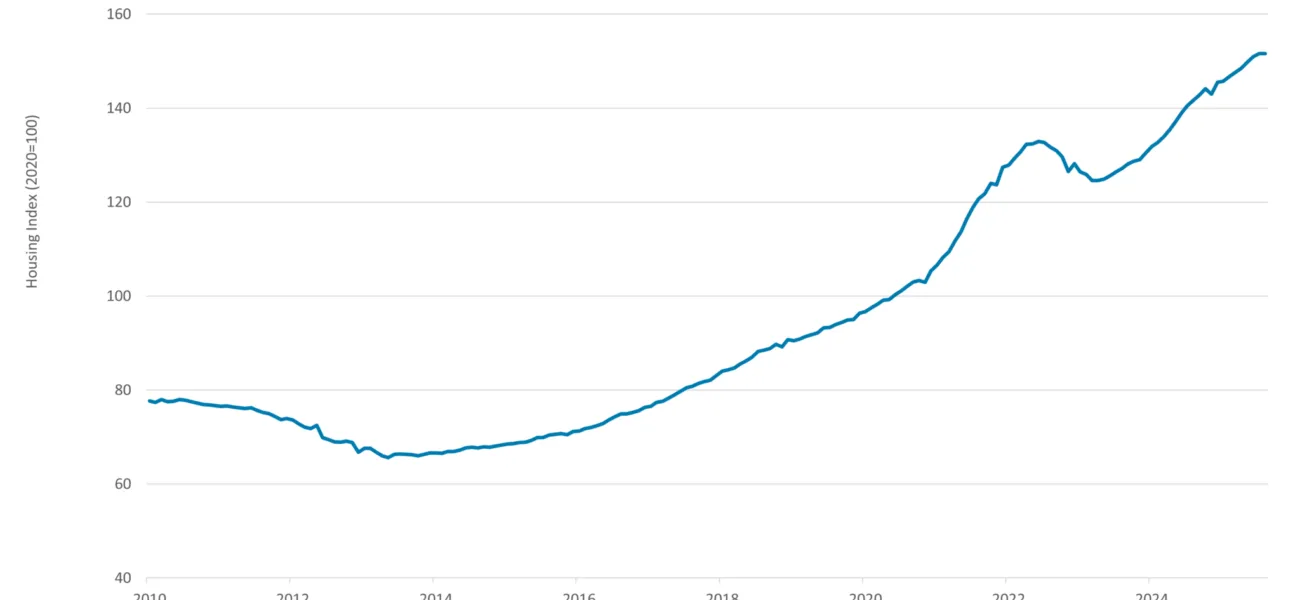
Source: Statistics Netherlands, DMPM analytics
House prices rise highest in outer suburban areas
For a long period, house prices rose by more than 10% annually, particularly in the western regions of the country. That trend has now come to an end. In the areas surrounding the four major cities, price growth has slowed down, reaching a maximum of 7.5% Y-o-Y. In some of the areas, prices have even declined slightly compared to previous quarter. This decrease is largely due to a higher volume of sales in flats and smaller homes, driven by an overall increase in the number of properties coming onto the market due to the Affordable Rent Act.
The northern regions of the country are experiencing the strongest price increases. In these regions we still see an increase in house prices of over 10% Y-o-Y (even reaching 12% Y-o-Y). For the region of Groningen, over 80% of homes are sold above the asking price, with selling prices averaging nearly 10% higher. In the northern Frisian regions, overbidding is somewhat less frequent. Nevertheless, prices there still show an annual increase of more than 11%. This supports the overall trend that the larger cities in the western part of the Netherlands are usually a frontrunner of house price development. Hence Groningen and Frisian regions are lagging compared to Amsterdam developments.
Housing transactions slightly decreased during the summer period
In Q3 2025, NVM realtors sold 41,800 homes, marking a 19% increase compared to the same period in 2024. Compared to the previous quarter, we see a slight decrease in the homes sold. This is a result of the yearly pattern of the summer period where the housing transactions decrease for a short period. The impact of the increasing housing transactions year-on-year is most notable in apartment sales, which have risen significantly over the past years.
Compared to five years ago, apartment sales have doubled. This growth is largely attributed to the Affordable Rent Act, which prompted many landlords to sell their properties rather than continue renting them out. But also the focus on affordable housing and inner-city new construction has attributed to this development. The graph below shows that since the increase in transfer tax for investors from 2% to 8% as of January 2021, investors have been selling more homes than they have been buying every year. Add to this the Affordable Rent Act of 2024, and you can see that this has had an even more reinforcing effect to date.
Figure 2: Home purchases and sales by investors
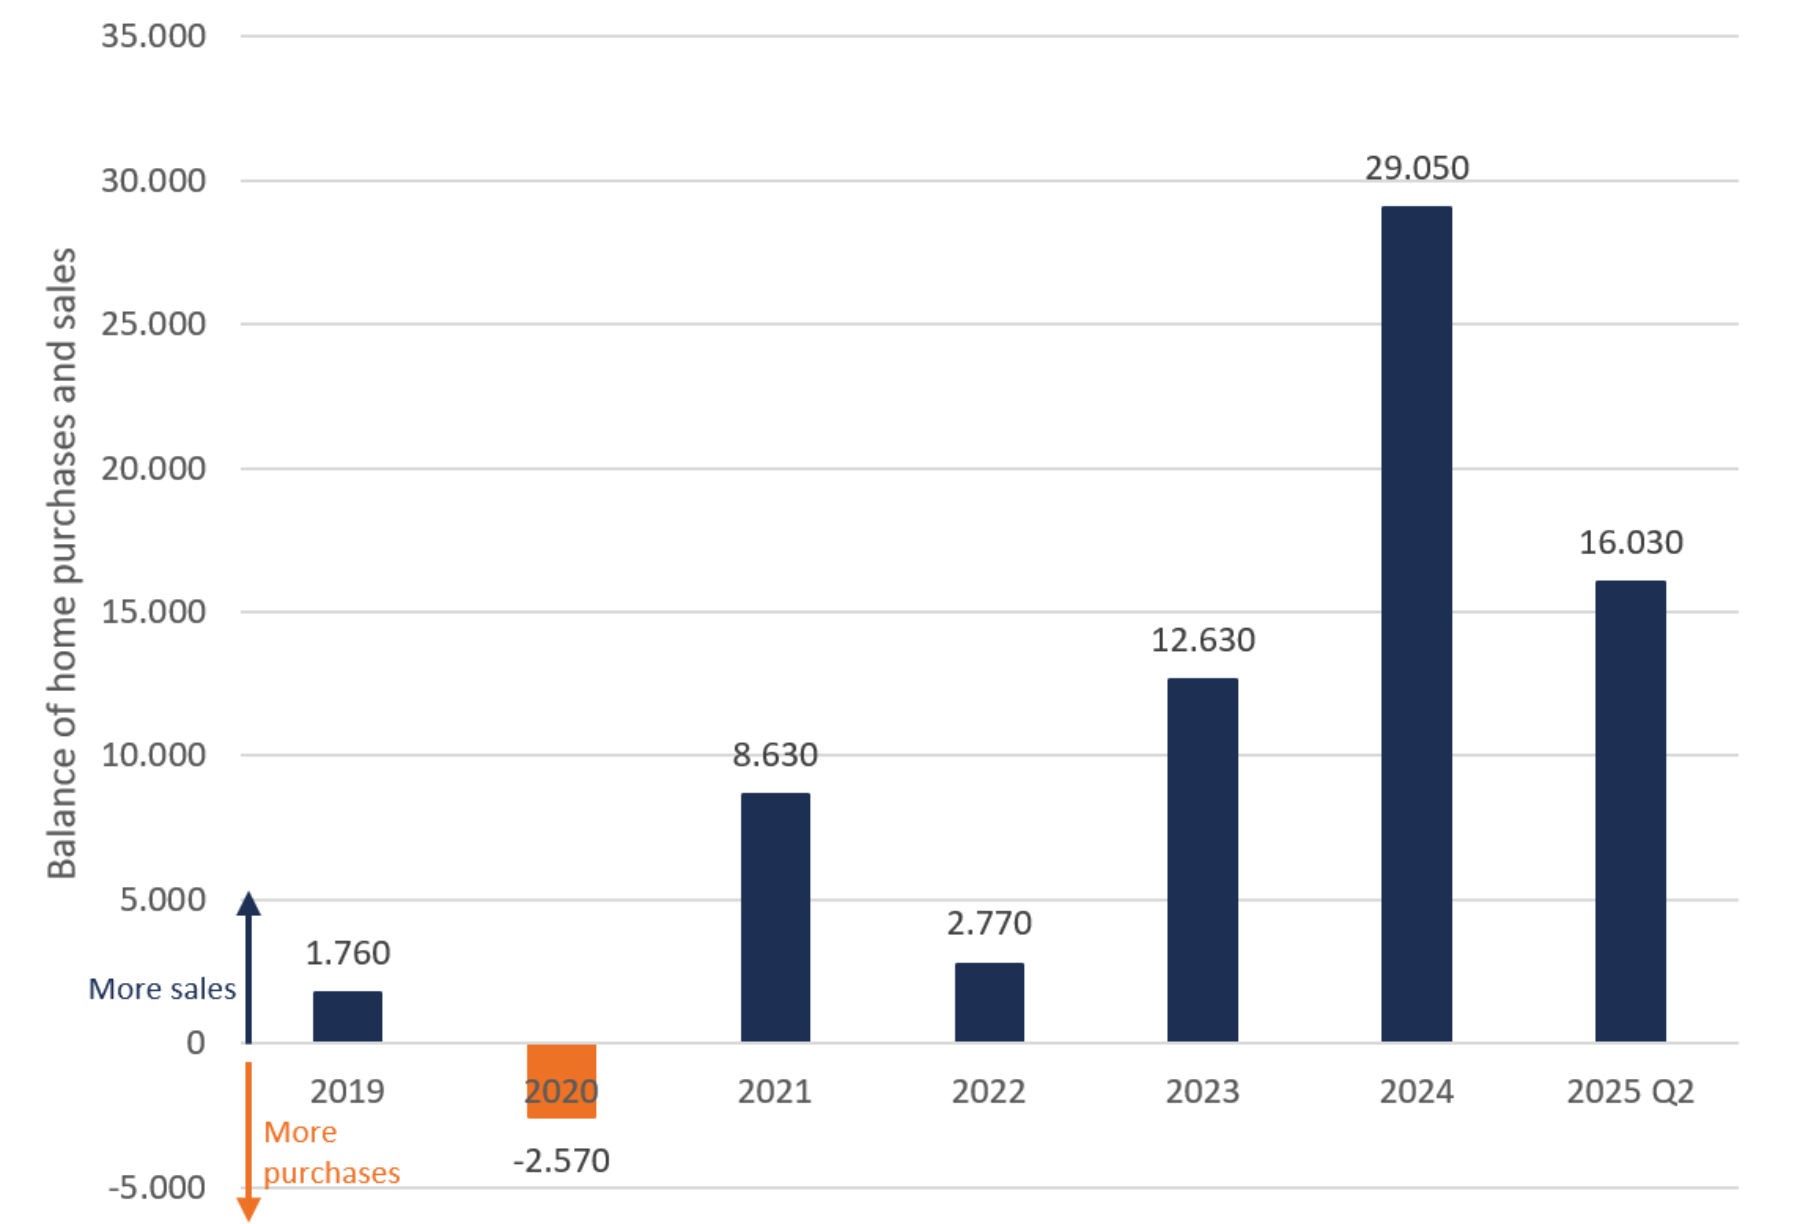
Source: Kadaster
Supply-demand ratio
The housing shortage indicator remains at the same level of 2.3 in the third quarter of 2025. This indicates that the number of choices for a potential buyer in the housing market has remained on the same low level.
Figure 3: Housing shortage indicator
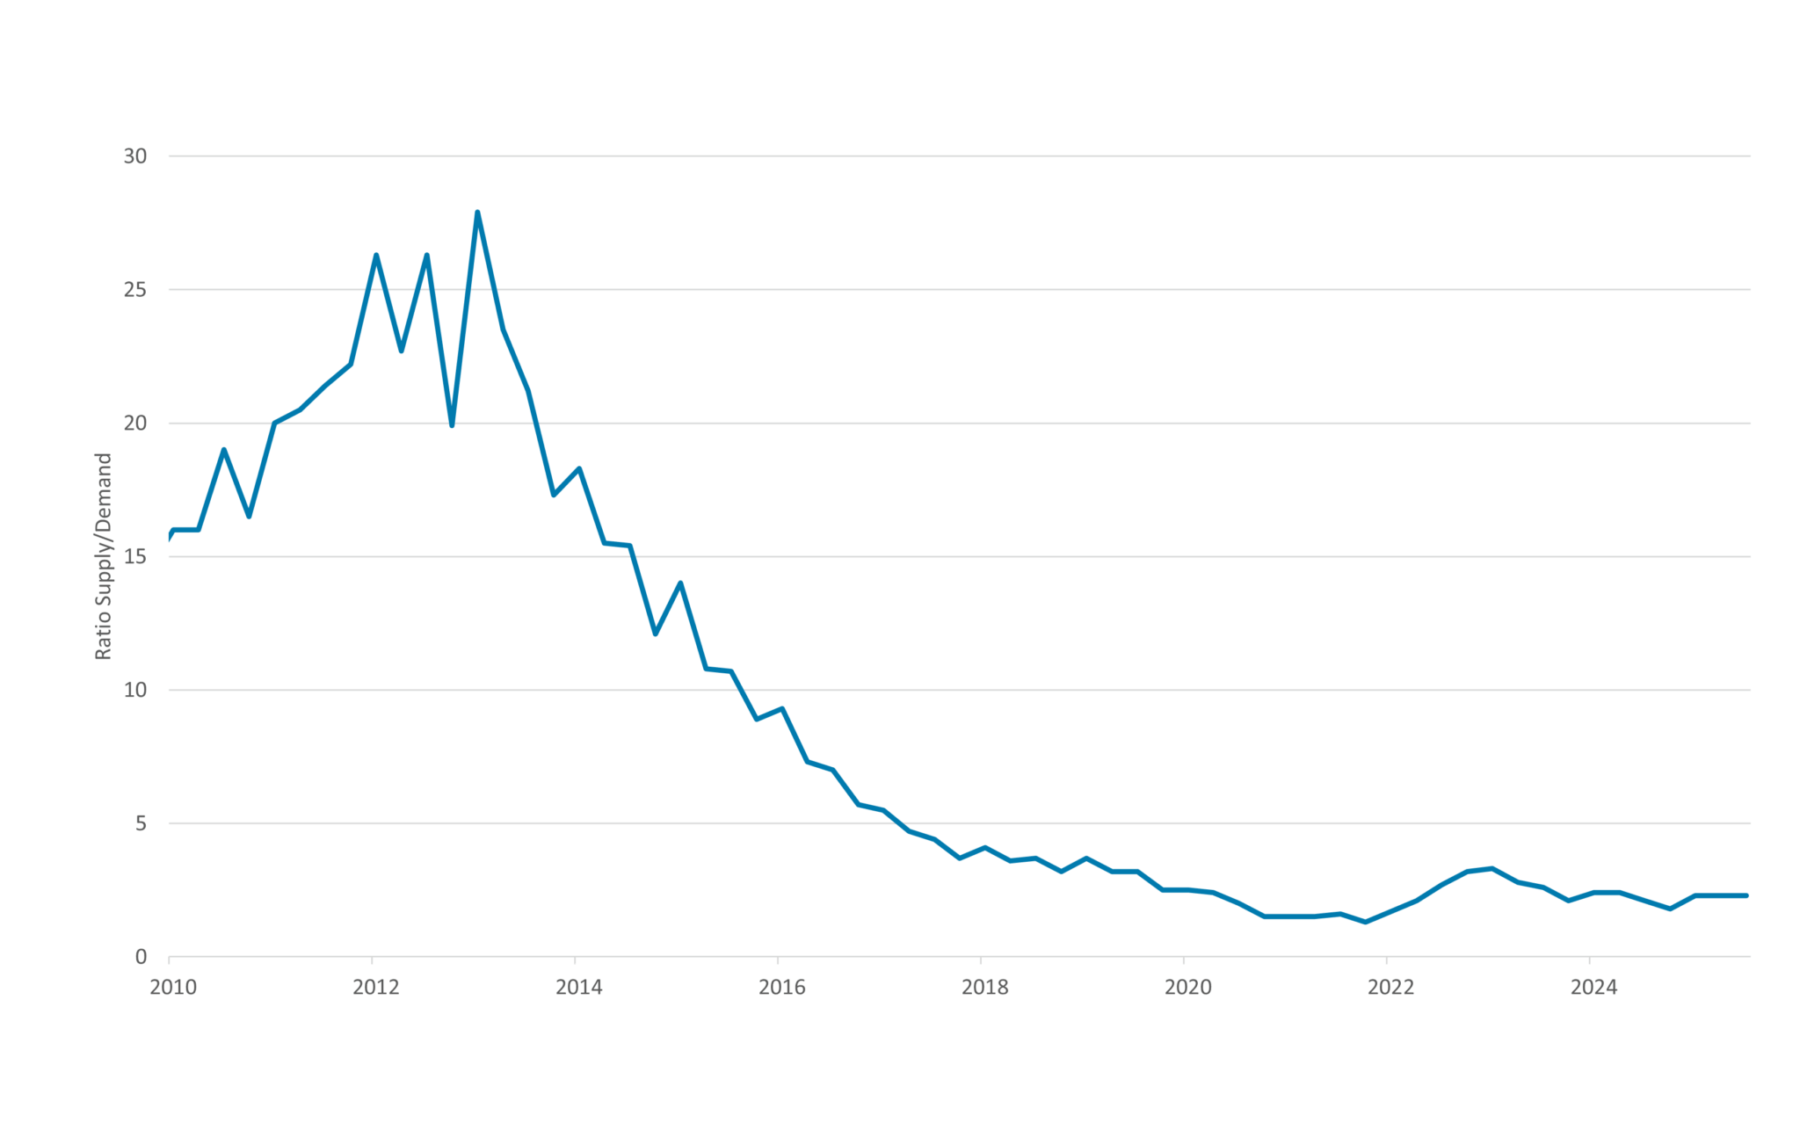
Source: NVM
Houses continue to sell within a month
The average time to sell a home remains very low but increased with 2 days to 29 days in the third quarter, with 81% of all properties selling within a single quarter. This slightly decreased during the third quarter but is still very high which shows that we are still in a seller’s market.
Figure 4: Average number of days needed to sell
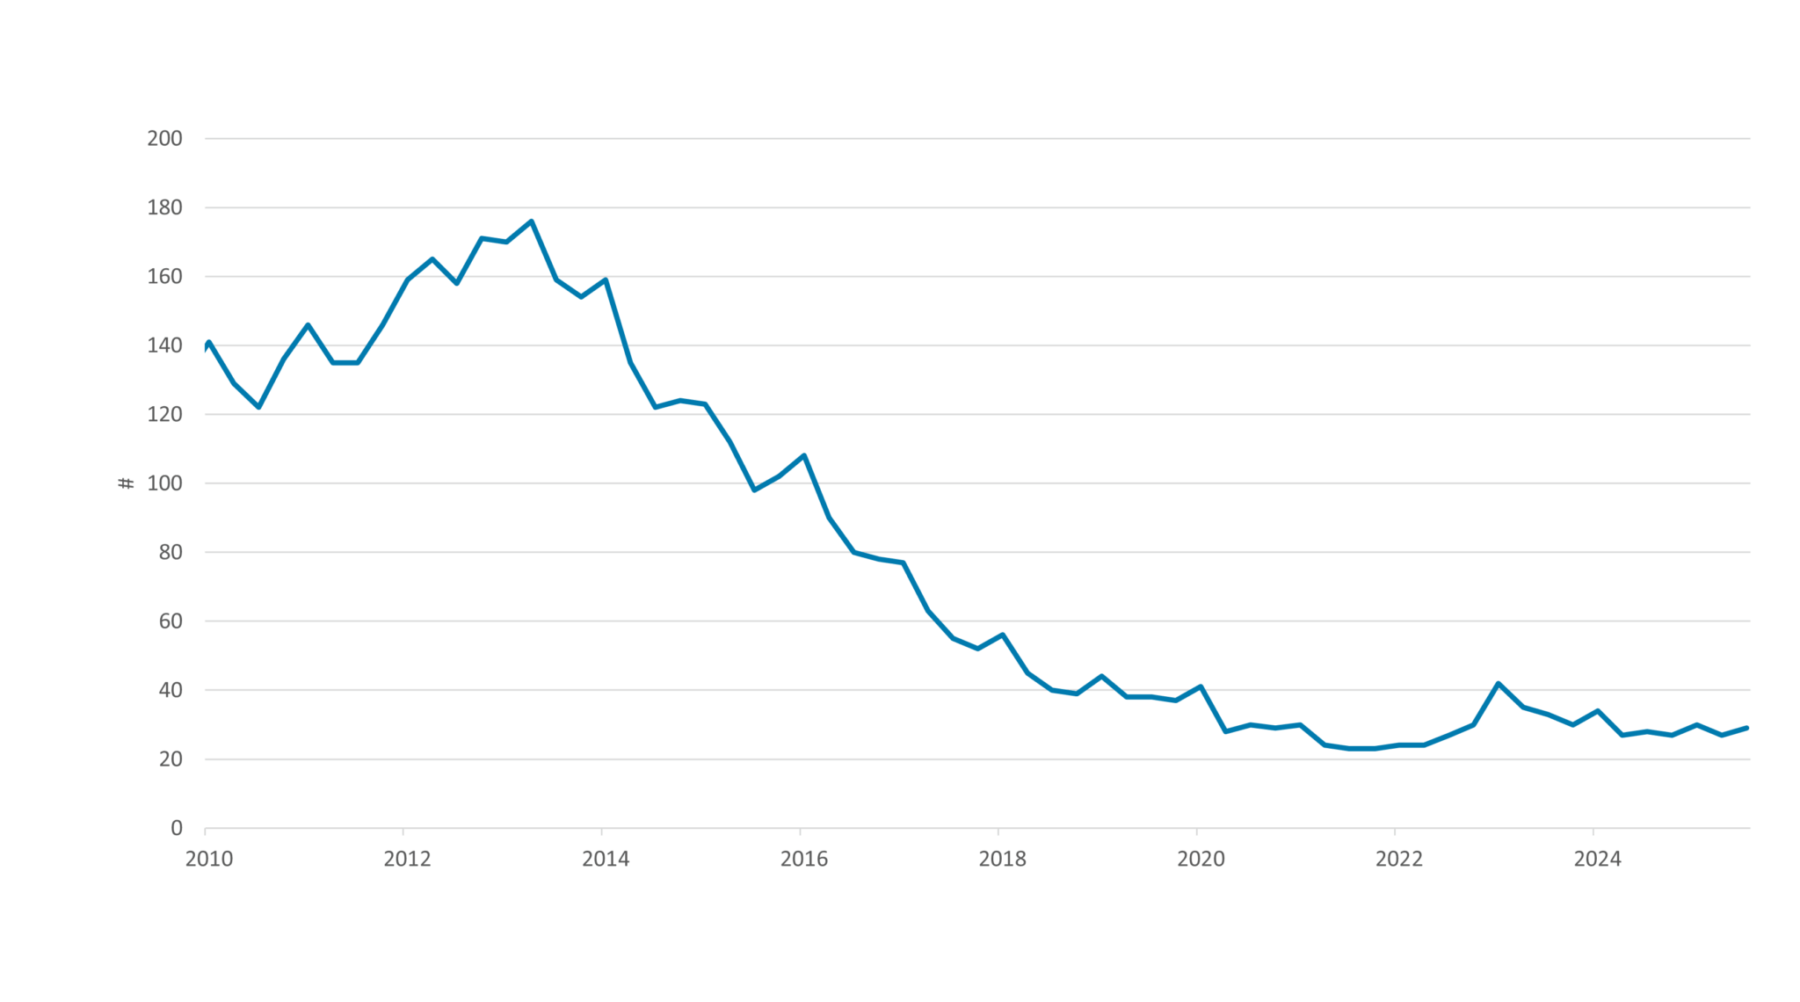
Source: NVM
Want to know more?
This article is the second chapter of our quarterly market update for Q3 2025. In this report, we outline developments in the Dutch economy, the housing market and the mortgage market.