

- ECB completes easing cycle, as inflation is expected to remain close to target
- Swap curve steepened significantly in 2025, potentially impacting fixed-rate preferences
Dutch labour market remains strong, supporting mortgage credit quality
ECB’s cutting cycle is complete
As markets widely expected, the ECB held the policy rates on hold in their September meeting. Therefore, the most relevant rate, the deposit rate, remained at 2%. The decision to hold rates steady was unanimous, which is a pretty strong signal that the bar for further rate cuts in the coming months is rather high.
Judging from the ECB’s macro-economic projections, inflation is expected to come at 2.1% in 2025 and 1.7% and 1.9% in respectively 2026 and 2027. Therefore, the rate of inflation has moved close to the 2% medium term target. With respect to the inflation outlook, the direction is uncertain. On the one hand, in case the euro remains strong or appreciates further, it could move inflation lower than expected. In addition, higher tariffs could slow foreign demand for euro goods, lowering price pressures within the eurozone even further. On the other hand, massive spending on defense and infrastructure could elevate the rate of inflation in the coming years. With respect to economic growth the economic outlook is more balanced according to the ECB. Economic growth is expected to hover at or slightly above 1% per year in the 2026 and 2027. With the recent trade agreements, downside risks of economic growth are reduced. But the continuing geopolitical tensions could bring that into jeopardy.
To conclude this ECB section, the rate cutting cycle that started in June 2024 came to an end in September. With the inflation rate at or close to the ECB target, there is no reason to ease further. Most major banks expect an unchanged policy rate for 2026. BNP Paribas, Goldman Sachs and Citi foresee steady rates through 2026 with inflation expected to hover near 2%.
10 year swap rate remains rangebound
The 10 year swap rate started the third quarter at 2.60% and ended the quarter slightly below 2.70%, see figure 1. Volatility was low in the third quarter, as the 10 year swap remained in a 10bp range.
Figure 1: Swap rates

Source: DMPM analytics
The 20 year swap behaved a bit different, as the 20 year swap increased 20bp from the start of the second quarter to the end of the third quarter. The steepness of this swapcurve is a topic that we also covered in our second quarter report. But given the relevance and the potential impact on the residential mortgage market, we will cover it again in the following paragraph.
Swap curve steepening continues
A market theme that continues to remain relevant is the steepness of the swap curve. And here we would like to focus on the 10 to 20 year section of the curve, given the relation and relevance to the Dutch residential mortgage market. A steeper curve can in theory have an influence on consumer preference for the fixed interest rate period, as a steeper curve means that each additional unit of time becomes relatively more expensive.
We decided to reuse figure 2 below from the Q1 2025 report, and we added the orange swap curve dated October 20th. The three curves clearly show that the steepening comes from both the front-end and the back-end of the curve. The steepening in the front-end can be attributed to the easing measure of the ECB. The back-end is trickier to explain. A factor that is likely related, is the increase in government bonds issuance in Germany, which drove long-end government bond yields upwards. This increase in long-end yields is also reflected in long-end swap rates.
Figure 2: Euro swap curves
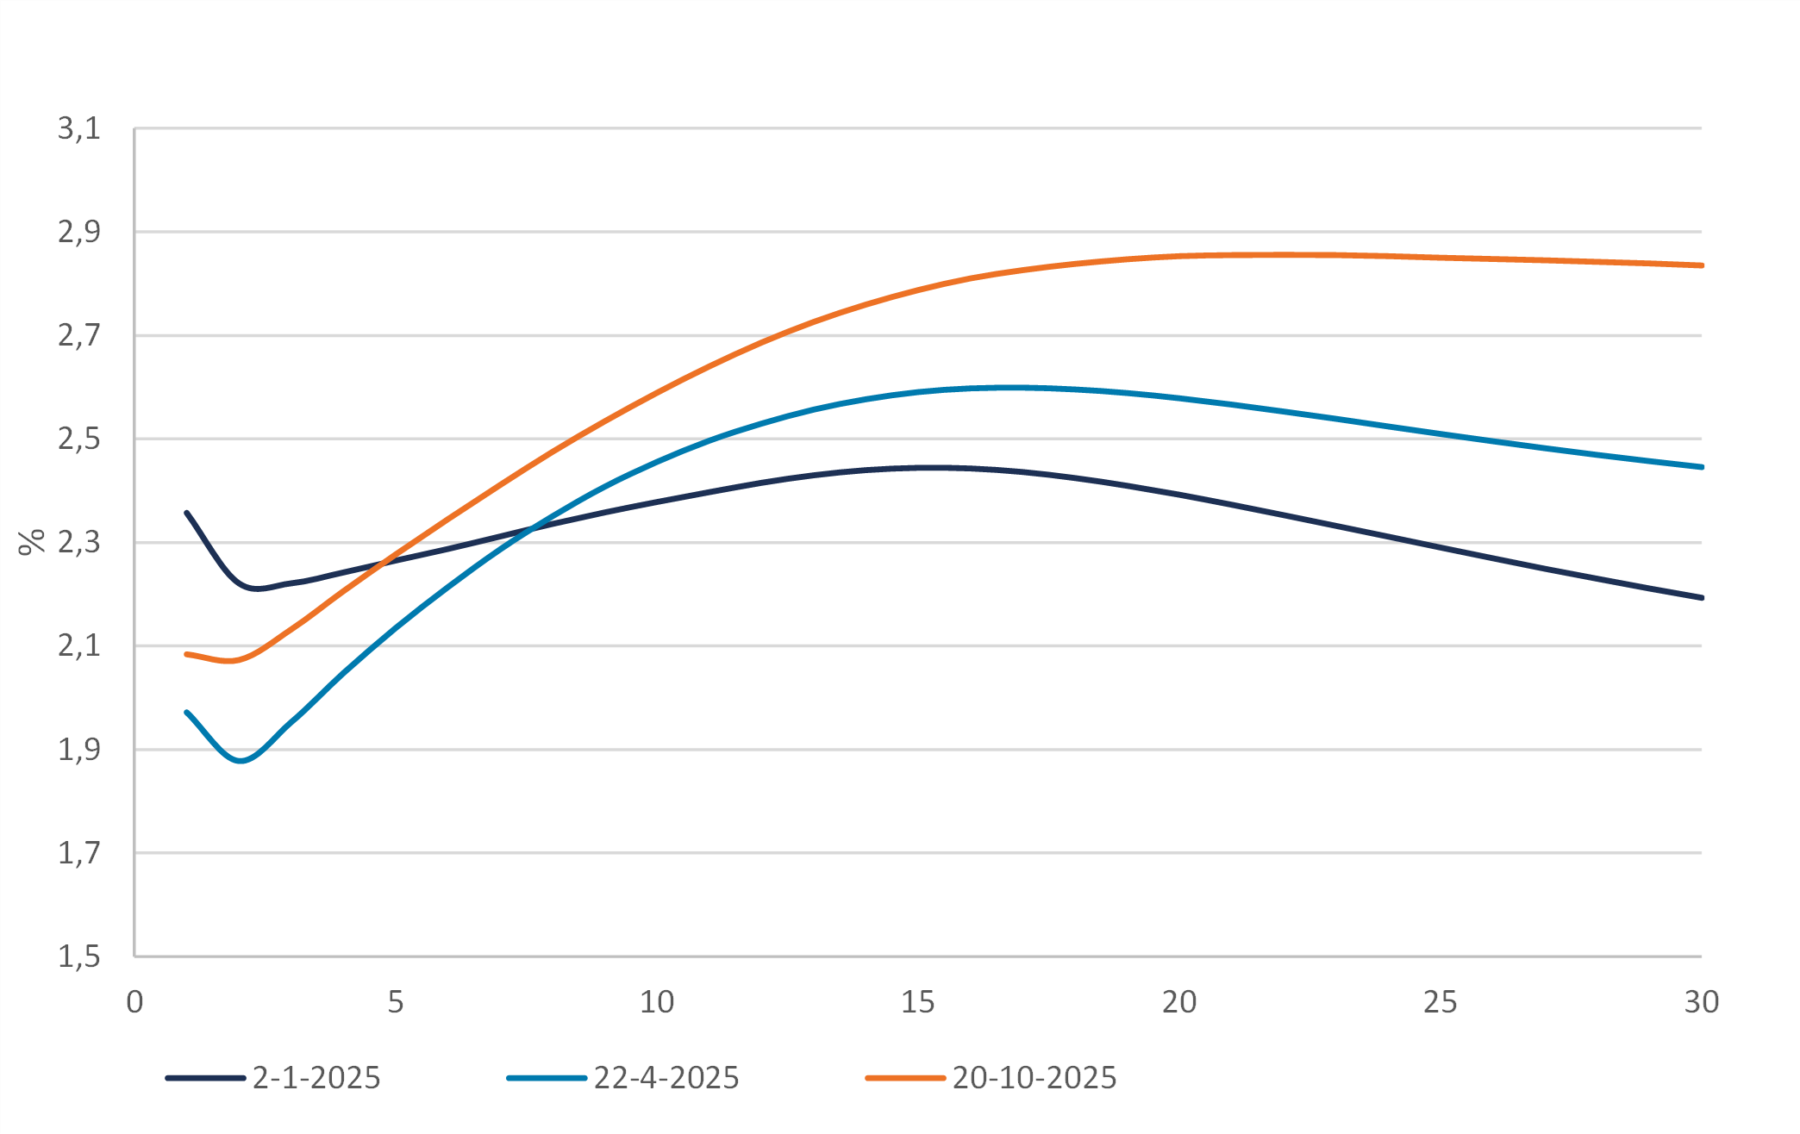
Source: DMPM analytics
Also noteworthy is the fact that the long-end of the swap curve is no longer inverse. In January the 20Y-30Y spread was -20bp and currently this spread is 0bp as can be seen in figure 2.
To conclude this section, we would like to underscore the extent of the steepening of the 10Y-20Y curve, see figure 3. At the start of the year this spread was close to 0bp, and it steepened more than 25bp.
Figure 3: 10-20Y swap curve spread

Source: DMPM analytics
Unemployment rate moving up slightly
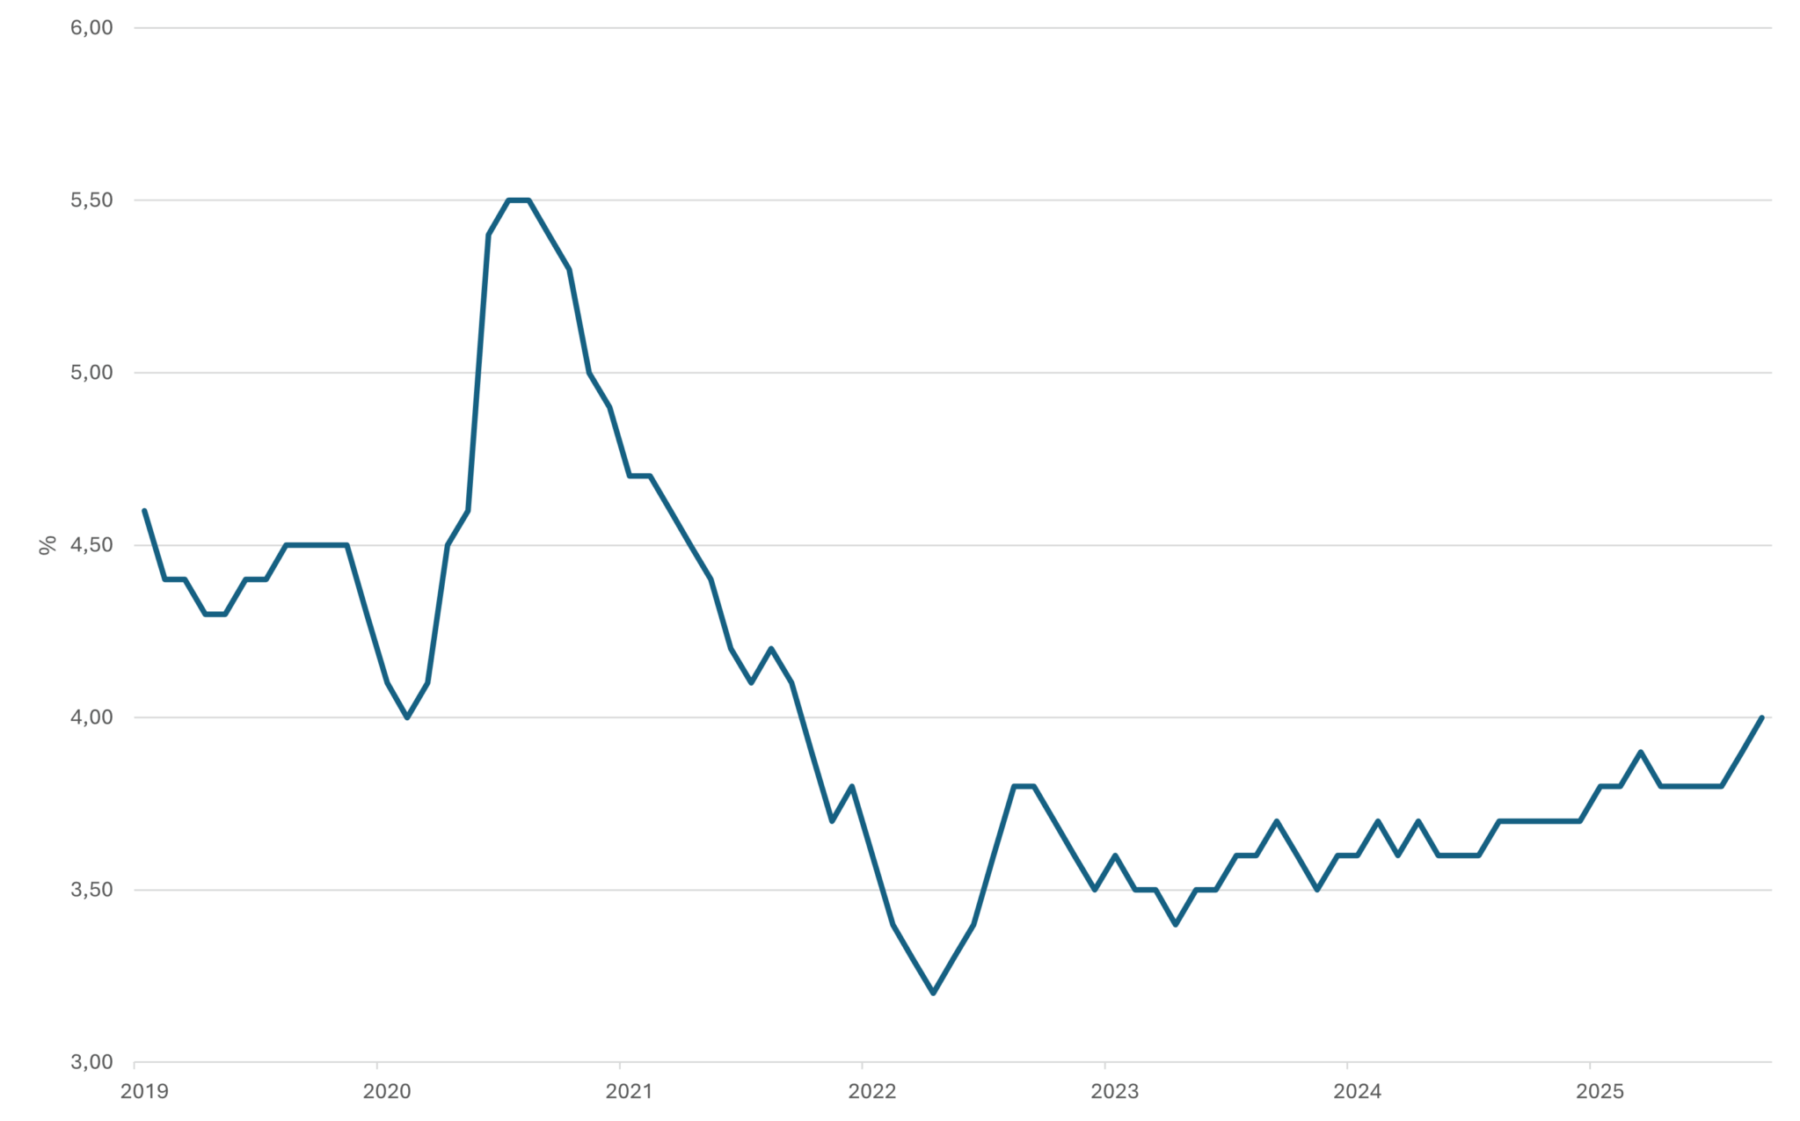
We haven’t covered the Dutch unemployment rate the last couple of quarters as it is more or less a flat line at a very low level. But it’s fair to say there is a slight uptrend visible recently. The latest reading from September was 4% from 3.7% at the start of the year, see figure 4. The increase is marginal, but it is something to keep an eye on the following quarter to see if the uptrend continues. On a sidenote, it’s good to know that the number of unemployment benefits has not changed since January. If more people get fired from their job, the unemployment benefits will increase. The increase in unemployment, with an unchanged number of unemployment benefits, can be explained by people that are currently unemployed but expect to start a new job in the near future. So maybe it can be concluded that we should not read too much in the increase of the unemployment rate.
Figure 4: Unemployement rate
Source: DMPM analytics
Labor participation structurally higher
There is one more aspect of the labor market that we would like to bring to attention and that is the labor participation in the Netherlands. As is visible in figure 5, the labor participation timeseries started to increase from 2014 onwards. And the difference is quite remarkable. The latest figure from September the participation rate was 73.4%, compared to an average of 67% between 2003 and 2013.
Figure 5: Labour participation rate
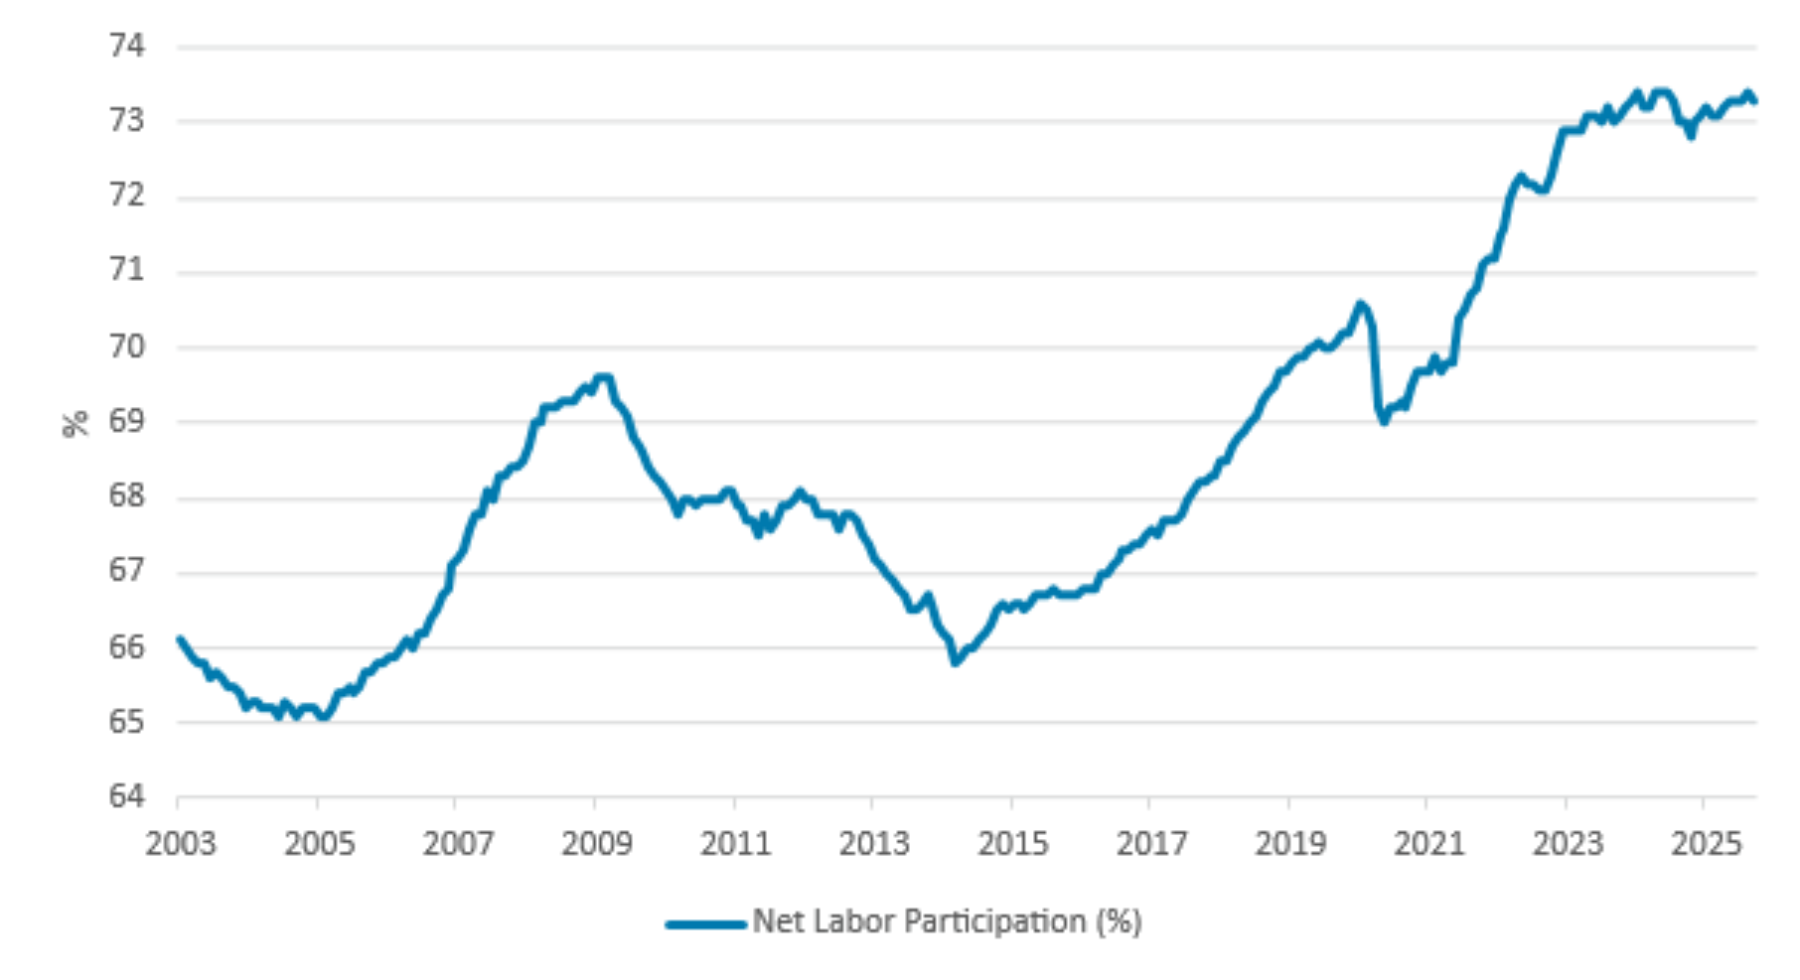
Source: Statistics Netherlands
The increase of the labor participation is of course also relevant for investors in mortgage receivables. As the labor participation rate increases, the affordability of owning a home also increases. This should also result in improving credit fundamentals. Although it’s fair to say that the Dutch mortgage market is already best known for the extremely low number of arrears. Given this low level of arrears, there is not much to improve.
Want to know more?
This article is the first chapter of our quarterly market update for Q3 2025. In this report, we outline developments in the Dutch economy, the housing market and the mortgage market.