


- Since the start of 2022, as a result of the rapid rise in mortgage rates, Dutch consumers opted for a much shorter fixed rate period
- Close to 80% of the mortgage applications have a maximum fixed rate term of 10 years
- The average fixed interest period of new mortgages loan applications hasn’t been this low
since 2016 - This shift in the weighted average maturity presents a unique opportunity for investors that
have a preference for the relative short maturity bucket, such as banks
Download here article as pdf
A HISTORICAL SHIFT IN FIXED INTEREST RATE PERIOD AND DURATION
As interest rates have risen since 2022, the preferences of consumers and brokers with respect to the fixed interest rate period has shifted significantly too. Figure 1 below shows the market share of each maturity bucket on a quarterly basis. In response to the rapid increase in mortgage rates at the beginning of 2022, consumers opted for a much shorter fixed
rate period. That explains the complete turnaround in market share of the maturity buckets.
Figure 1: Market share per maturity bucket (ex. Loan porting)

What will consumers do in the next few years
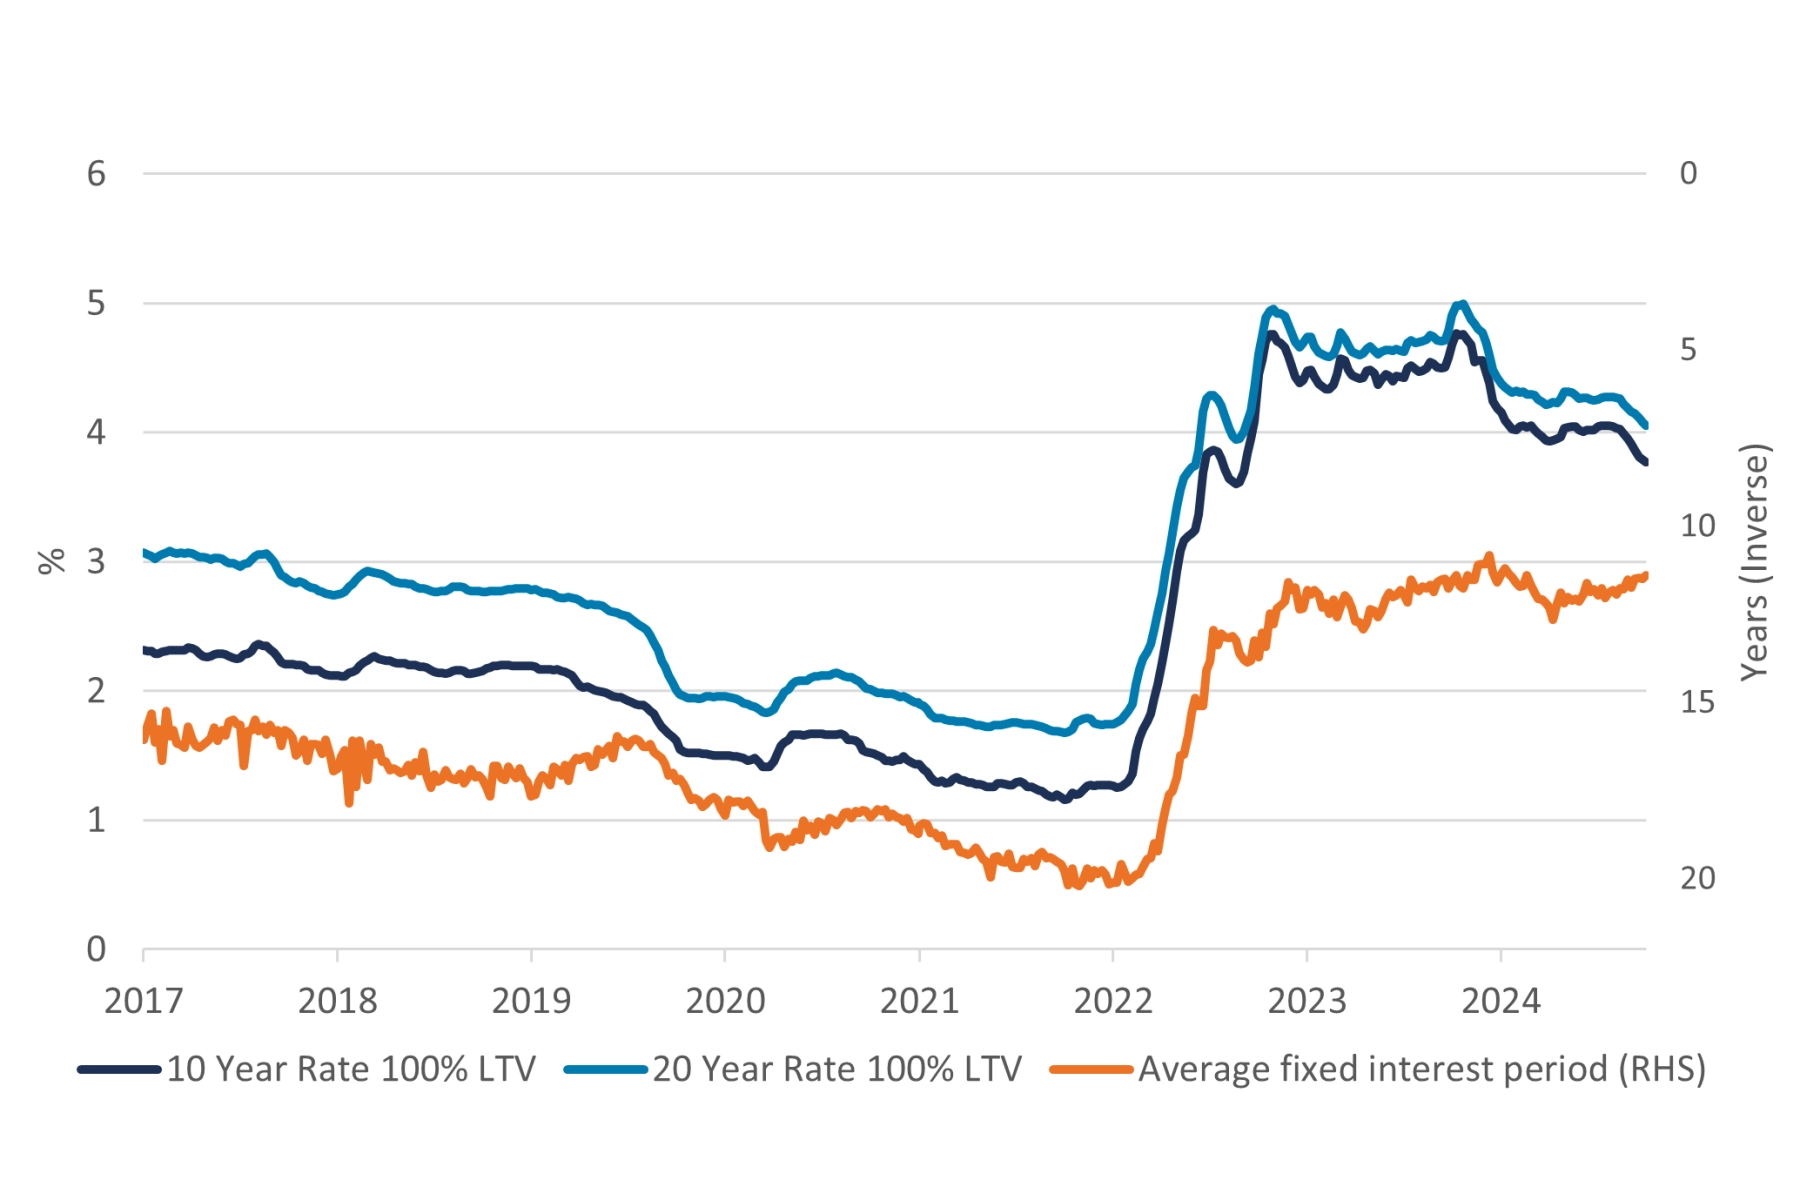
Since the top in mortgage rates at the end of 2023, see the dark and light blue timeseries in figure 3, rates have moved 100bp lower. Despite this
significant move, consumers haven’t opted for longer maturities. For example, as is clear from figure 1, the market shares of all maturity buckets remained more or less unchanged in 2024. To visualize the relation between mortgage rates and the average fixed interest period of new mortgage loan applications, we combined the two variables in figure 3 below. Do take note of the reverse order of the average fixed interest period of new mortgage loan applications on axis on the right hand side.
For example, in 2020 the market share of the 11-20 year maturity bucket was 60% and less than 25% for the 6-10 year maturity bucket. In addition, sub 5 year sector was hardly existent. Starting in 2022 and beyond, this completely reversed. In the third quarter of 2024 the market share of the sub 10 year maturity bucket was 80% versus 15% for the 11-20 year sector and around 5% for 21-30 year sector.
This shift in fixed rate preference can also be visualized in terms of the average fixed interest period of new mortgage loan applications. Figure 2 below illustrates the significant shift from 20 years in 2022 to 11 years in 2024. The current average fixed rate period of around 11 years, hasn’t been this low since 2016.
Figure 2: Average fixed period new mortgage applications

What will consumers do in the next few years
Since the top in mortgage rates at the end of 2023, see the dark and light blue timeseries in figure 3, rates have moved 100bp lower. Despite this
significant move, consumers haven’t opted for longer maturities. For example, as is clear from figure 1, the market shares of all maturity buckets remained more or less unchanged in 2024. To visualize the relation between mortgage rates and the average fixed interest period of new mortgage loan applications, we combined the two variables in figure 3 below. Do take note of the reverse order of the average fixed interest period of new mortgage loan applications on axis on the right hand side. The inverse relation and good fit is clear in figure 3. But, as mentioned early, despite the drop in mortgage rates, the average fixed rate period has
not moved up yet in recent months. Given the ECB trajectory to lower policy rates, further curve normalization and lower rates across the curve
are expected. But what will consumers do and also when? Although it’s hard to predict when consumers will respond, it’s a near certainty,
provided continuation of the downward trajectory of interest rates, that consumers will opt for longer maturities. The only remaining question is when. For bank investors this is something to take into consideration.
Figure 3: Mortgage rates vs average fixed interest period new mortgage applications
What about volumes in the sub 10 year sector
The increase in market shares of the 0-5 year and 6-10 year maturity buckets already revealed what happened in terms of volumes. Figure 4 accentuates what it means in terms of volumes in the sub 10 year. For example, in the first, second and third quarter of 2024 the Dutch mortgage application volume was respectively €14bn, €15bn and €17bn. This compares with a total application volume of €18bn, €20bn and €21bn during the first, second and third quarter of 2024.
Figure 4: Mortgage application volume (ex. loan porting)

An opportunity for short duration investors
The magnitude and, more notably, the number of consecutive interest rate increases observed in 2022 represents an uncommon occurrence. This phenomenon is paralleled by a substantial reduction in the average fixed interest period of new mortgage loan applications. The low averagefixed interest period presents a significant opportunity for bank investors. Furthermore, there are no volume constraints, as the quarterly issuance of up to €17 billion should suffice to accommodate even the most substantial investment mandates.